










































New to KubeDB? Please start here.
Monitoring PerconaXtraDB Using Prometheus operator
Prometheus operator provides simple and Kubernetes native way to deploy and configure Prometheus server. This tutorial will show you how to use Prometheus operator to monitor PerconaXtraDB database deployed with KubeDB.
Before You Begin
At first, you need to have a Kubernetes cluster, and the kubectl command-line tool must be configured to communicate with your cluster. If you do not already have a cluster, you can create one by using kind.
To learn how Prometheus monitoring works with KubeDB in general, please visit here.
To keep database resources isolated, this tutorial uses a separate namespace called
demothroughout this tutorial. Run the following command to prepare your cluster:$ kubectl create ns demo namespace/demo createdWe need a Prometheus operator instance running. If you don’t already have a running instance, deploy one following the docs from here.
If you already don’t have a Prometheus server running, deploy one following tutorial from here.
Note: YAML files used in this tutorial are stored in /docs/guides/percona-xtradb/monitoring/prometheus-operator/examples folder in GitHub repository kubedb/docs.
Configuration
Step 1 (
kube-prometheus-stack) is required to follow this tutorial. Step 2 (Panopticon) is not needed for the Prometheus Operator / ServiceMonitor scraping documented on this page — install it only if you also plan to use the KubeDB Grafana dashboards’ status panels, or phase-based Alerting. If you have already completed the step(s) you need in another guide, skip ahead.
Step 1: Deploy kube-prometheus-stack
kube-prometheus-stack installs Prometheus, Prometheus Operator, Alertmanager, and Grafana together. This is the recommended way to get the full monitoring stack on Kubernetes. This is where Grafana itself gets installed for this tutorial track — the Grafana Dashboard guide’s “Access Grafana” step assumes it’s already running from here; you do not install Grafana again there.
Add the prometheus-community Helm repo and install:
$ helm repo add prometheus-community https://prometheus-community.github.io/helm-charts
$ helm repo update

$ helm upgrade --install prometheus prometheus-community/kube-prometheus-stack \
  --namespace monitoring \
  --set grafana.image.tag=7.5.5
Wait for all pods to be ready:
$ kubectl get pods -n monitoring
NAME                                                   READY   STATUS    RESTARTS   AGE
alertmanager-prometheus-kube-prometheus-alertmanager-0 2/2     Running   0          2m
prometheus-grafana-xxxx                                3/3     Running   0          2m
prometheus-kube-prometheus-operator-xxxx               1/1     Running   0          2m
prometheus-kube-prometheus-prometheus-0                2/2     Running   0          2m
prometheus-kube-state-metrics-xxxx                     1/1     Running   0          2m
Find the serviceMonitorSelector label that Prometheus uses to pick up ServiceMonitor objects. You will need this label when enabling monitoring on the PerconaXtraDB instance.
$ kubectl get prometheus -n monitoring -o jsonpath='{.items[0].spec.serviceMonitorSelector}'
{"matchLabels":{"release":"prometheus"}}
The label is release: prometheus.
Step 2: Install Panopticon (optional — only for Grafana dashboards & Alerting)
Panopticon is the Appscode operator that reads MetricsConfiguration objects (created by kubedb-metrics) and exposes them to Prometheus. It is not required for the Prometheus Operator / ServiceMonitor scraping covered on this page — skip it, and skip enabling kubedb-metrics too, if you only need raw metrics in Prometheus. Install it only if you also plan to use the phase/status panels of the KubeDB Grafana dashboards, or phase-based Alerting — and install it before enabling kubedb-metrics.
$ helm repo add appscode https://charts.appscode.com/stable/
$ helm repo update

$ helm upgrade --install panopticon appscode/panopticon \
  --version v2026.4.30 \
  --namespace kubeops --create-namespace \
  --set monitoring.enabled=true \
  --set monitoring.agent=prometheus.io/operator \
  --set monitoring.serviceMonitor.labels.release=prometheus \
  --set-file license=/path/to/kubedb-license.txt \
  --wait --timeout 5m0s
Verify panopticon is running:
$ kubectl get pods -n kubeops
NAME                          READY   STATUS    RESTARTS   AGE
panopticon-xxxx               1/1     Running   0          1m
Find out required labels for ServiceMonitor
We need to know the labels used to select ServiceMonitor by a Prometheus crd. We are going to provide these labels in spec.monitor.prometheus.labels field of PerconaXtraDB crd so that KubeDB creates ServiceMonitor object accordingly.
At first, let’s find out the available Prometheus server in our cluster.
$ kubectl get prometheus --all-namespaces
NAMESPACE   NAME         VERSION   REPLICAS   AGE
default     prometheus             1          2m19s
If you don’t have any Prometheus server running in your cluster, deploy one following the guide specified in Before You Begin section.
Now, let’s view the YAML of the available Prometheus server prometheus in default namespace.
$ kubectl get prometheus -n default prometheus -o yaml
apiVersion: monitoring.coreos.com/v1
kind: Prometheus
metadata:
  annotations:
    kubectl.kubernetes.io/last-applied-configuration: |
      {"apiVersion":"monitoring.coreos.com/v1","kind":"Prometheus","metadata":{"annotations":{},"labels":{"prometheus":"prometheus"},"name":"prometheus","namespace":"default"},"spec":{"replicas":1,"resources":{"requests":{"memory":"400Mi"}},"serviceAccountName":"prometheus","serviceMonitorNamespaceSelector":{"matchLabels":{"prometheus":"prometheus"}},"serviceMonitorSelector":{"matchLabels":{"release":"prometheus"}}}}
  creationTimestamp: "2020-08-25T04:02:07Z"
  generation: 1
  labels:
    prometheus: prometheus
  ...
    manager: kubectl
    operation: Update
    time: "2020-08-25T04:02:07Z"
  name: prometheus
  namespace: default
  resourceVersion: "2087"
  selfLink: /apis/monitoring.coreos.com/v1/namespaces/default/prometheuses/prometheus
  uid: 972a50cb-b751-418b-b2bc-e0ecc9232730
spec:
  replicas: 1
  resources:
    requests:
      memory: 400Mi
  serviceAccountName: prometheus
  serviceMonitorNamespaceSelector:
    matchLabels:
      prometheus: prometheus
  serviceMonitorSelector:
    matchLabels:
      release: prometheus
spec.serviceMonitorSelectorfield specifies which ServiceMonitors should be included. The Above labelrelease: prometheusis used to selectServiceMonitorsby its selector. So, we are going to use this label inspec.monitor.prometheus.labelsfield of PerconaXtraDB crd.spec.serviceMonitorNamespaceSelectorfield specifies that theServiceMonitorscan be selected outside the Prometheus namespace by Prometheus using namespace selector. The Above labelprometheus: prometheusis used to select the namespace where theServiceMonitoris created.
Add Label to database namespace
KubeDB creates a ServiceMonitor in database namespace demo. We need to add label to demo namespace. Prometheus will select this namespace by using its spec.serviceMonitorNamespaceSelector field.
Let’s add label prometheus: prometheus to demo namespace,
$ kubectl patch namespace demo -p '{"metadata":{"labels": {"prometheus":"prometheus"}}}'
namespace/demo patched
Deploy PerconaXtraDB with Monitoring Enabled
At first, let’s deploy an PerconaXtraDB database with monitoring enabled. Below is the PerconaXtraDB object that we are going to create.
apiVersion: kubedb.com/v1
kind: PerconaXtraDB
metadata:
  name: coreos-prom-px
  namespace: demo
spec:
  version: "8.4.3"
  deletionPolicy: WipeOut
  storage:
    storageClassName: "standard"
    accessModes:
    - ReadWriteOnce
    resources:
      requests:
        storage: 1Gi
  monitor:
    agent: prometheus.io/operator
    prometheus:
      serviceMonitor:
        labels:
          release: prometheus
        interval: 10s
Here,
monitor.agent: prometheus.io/operatorindicates that we are going to monitor this server using Prometheus operator.monitor.prometheus.labelsspecifies that KubeDB should createServiceMonitorwith these labels.monitor.prometheus.intervalindicates that the Prometheus server should scrape metrics from this database with 10 seconds interval.
Let’s create the PerconaXtraDB object that we have shown above,
$ kubectl create -f https://github.com/kubedb/docs/raw/v2026.7.10/docs/guides/percona-xtradb/monitoring/prometheus-operator/examples/prom-operator-px.yaml
perconaxtradb.kubedb.com/coreos-prom-px created
Now, wait for the database to go into Ready state.
$ kubectl get perconaxtradb -n demo coreos-prom-px
NAME             VERSION   STATUS   AGE
coreos-prom-px   8.4.3    Ready    59s
KubeDB will create a separate stats service with name {PerconaXtraDB crd name}-stats for monitoring purpose.
$ $ kubectl get svc -n demo --selector="app.kubernetes.io/instance=coreos-prom-px"
NAME                   TYPE        CLUSTER-IP      EXTERNAL-IP   PORT(S)     AGE
coreos-prom-px         ClusterIP   10.99.96.226    <none>        3306/TCP    107s
coreos-prom-px-pods    ClusterIP   None            <none>        3306/TCP    107s
coreos-prom-px-stats   ClusterIP   10.101.190.67   <none>        56790/TCP   107s
Here, coreos-prom-px-stats service has been created for monitoring purpose.
Let’s describe this stats service.
$ kubectl describe svc -n demo coreos-prom-px-stats
Name:              coreos-prom-px-stats
Namespace:         demo
Labels:            app.kubernetes.io/instance=coreos-prom-px
                   app.kubernetes.io/managed-by=kubedb.com
                   app.kubernetes.io/name=perconaxtradbs.kubedb.com
                   kubedb.com/role=stats
Annotations:       monitoring.appscode.com/agent: prometheus.io/operator
Selector:          app.kubernetes.io/instance=coreos-prom-px,app.kubernetes.io/managed-by=kubedb.com,app.kubernetes.io/name=perconaxtradbs.kubedb.com
Type:              ClusterIP
IP:                10.101.190.67
Port:              metrics  56790/TCP
TargetPort:        metrics/TCP
Endpoints:         10.244.0.31:56790
Session Affinity:  None
Events:            <none>
Notice the Labels and Port fields. ServiceMonitor will use these information to target its endpoints.
KubeDB will also create a ServiceMonitor crd in demo namespace that select the endpoints of coreos-prom-px-stats service. Verify that the ServiceMonitor crd has been created.
$ kubectl get servicemonitor -n demo
NAME                   AGE
coreos-prom-px-stats   4m8s
Let’s verify that the ServiceMonitor has the label that we had specified in spec.monitor section of PerconaXtraDB crd.
$ kubectl get servicemonitor -n demo coreos-prom-px-stats -o yaml
apiVersion: monitoring.coreos.com/v1
kind: ServiceMonitor
metadata:
  creationTimestamp: "2021-03-19T10:09:03Z"
  generation: 1
  labels:
    app.kubernetes.io/component: database
    app.kubernetes.io/instance: coreos-prom-px
    app.kubernetes.io/managed-by: kubedb.com
    app.kubernetes.io/name: perconaxtradbs.kubedb.com
    release: prometheus
  managedFields:
    ...
  name: coreos-prom-px-stats
  namespace: demo
  ownerReferences:
  - apiVersion: v1
    blockOwnerDeletion: true
    controller: true
    kind: Service
    name: coreos-prom-px-stats
    uid: 08260a99-0984-4d90-bf68-34080ad0ee5b
  resourceVersion: "241637"
  selfLink: /apis/monitoring.coreos.com/v1/namespaces/demo/servicemonitors/coreos-prom-px-stats
  uid: 4f022d98-d2d8-490f-9548-f6367d03ae1f
spec:
  endpoints:
  - bearerTokenSecret:
      key: ""
    honorLabels: true
    interval: 10s
    path: /metrics
    port: metrics
  namespaceSelector:
    matchNames:
    - demo
  selector:
    matchLabels:
      app.kubernetes.io/instance: coreos-prom-px
      app.kubernetes.io/managed-by: kubedb.com
      app.kubernetes.io/name: perconaxtradbs.kubedb.com
      kubedb.com/role: stats
Notice that the ServiceMonitor has label release: prometheus that we had specified in PerconaXtraDB crd.
Also notice that the ServiceMonitor has selector which match the labels we have seen in the coreos-prom-px-stats service. It also, target the prom-http port that we have seen in the stats service.
Verify Monitoring Metrics
At first, let’s find out the respective Prometheus pod for prometheus Prometheus server.
$ kubectl get pod -n default -l=app=prometheus
NAME                      READY   STATUS    RESTARTS   AGE
prometheus-prometheus-0   3/3     Running   1          16m
prometheus-prometheus-1   3/3     Running   1          16m
prometheus-prometheus-2   3/3     Running   1          16m
Prometheus server is listening to port 9090 of prometheus-prometheus-0 pod. We are going to use port forwarding to access Prometheus dashboard.
Run following command on a separate terminal to forward the port 9090 of prometheus-prometheus-0 pod,
$ kubectl port-forward -n default prometheus-prometheus-0 9090
Forwarding from 127.0.0.1:9090 -> 9090
Forwarding from [::1]:9090 -> 9090
Now, we can access the dashboard at localhost:9090. Open http://localhost:9090 in your browser. You should see prom-http endpoint of coreos-prom-px-stats service as one of the targets.
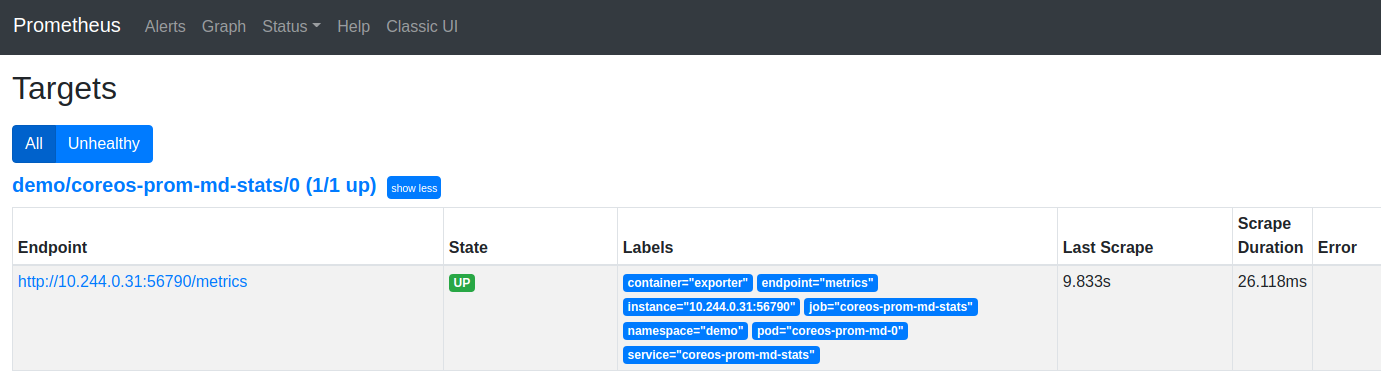
Check the endpoint and service labels. It verifies that the target is our expected database. Now, you can view the collected metrics and create a graph from homepage of this Prometheus dashboard. You can also use this Prometheus server as data source for Grafana and create beautiful dashboard with collected metrics.
Cleaning up
To cleanup the Kubernetes resources created by this tutorial, run following commands
# cleanup database
kubectl delete perconaxtradb -n demo coreos-prom-px

# cleanup panopticon
helm uninstall panopticon -n kubeops

# if you also completed the Grafana Dashboard tutorial, clean that up first —
# see https://kubedb.com/docs/guides/percona-xtradb/monitoring/grafana-dashboard.md#cleaning-up

# cleanup Prometheus resources
kubectl delete -f https://raw.githubusercontent.com/appscode/third-party-tools/master/monitoring/prometheus/operator/artifacts/prometheus.yaml

kubectl delete -f https://raw.githubusercontent.com/appscode/third-party-tools/master/monitoring/prometheus/operator/artifacts/prometheus-rbac.yaml

# cleanup Prometheus operator resources
kubectl delete -f https://raw.githubusercontent.com/prometheus-operator/prometheus-operator/release-0.41/bundle.yaml

# delete namespace
kubectl delete ns demo