










































New to KubeDB? Please start here.
MySQL Alerting with Prometheus
This tutorial shows you how to configure Prometheus-based alerting for a KubeDB-managed MySQL instance using the mysql-alerts Helm chart, and how to visualise live metrics using the kubedb-grafana-dashboards chart.
Before You Begin
Ensure you have a Kubernetes cluster and that
kubectlis configured to communicate with it. If you do not already have a cluster, you can create one using kind.Install the KubeDB operator by following the steps here.
Deploy the database in the
alert-mysqlnamespace:$ kubectl create ns alert-mysql namespace/alert-mysql createdTo learn more about how Prometheus monitoring works with KubeDB, see the overview here.
Note: YAML files used in this tutorial are stored in docs/examples/mysql folder in GitHub repository kubedb/docs.
Configuration
Step 1 (
kube-prometheus-stack) is required to follow this tutorial. Step 2 (Panopticon) is required for the Provisioner Group alerts below (KubeDBMySQLPhase...) — skip it only if you just want the exporter-based Database Group alerts. If you have already completed the step(s) you need in another guide, skip ahead.
Step 1: Deploy kube-prometheus-stack
kube-prometheus-stack installs Prometheus, Prometheus Operator, Alertmanager, and Grafana together. This is the recommended way to get the full monitoring stack on Kubernetes.
Add the prometheus-community Helm repo and install:
$ helm repo add prometheus-community https://prometheus-community.github.io/helm-charts
$ helm repo update
$ helm upgrade --install prometheus prometheus-community/kube-prometheus-stack \
--namespace monitoring --create-namespace \
--set grafana.image.tag=7.5.5
Wait for all pods to be ready:
$ kubectl get pods -n monitoring
NAME READY STATUS RESTARTS AGE
alertmanager-prometheus-kube-prometheus-alertmanager-0 2/2 Running 0 2m
prometheus-grafana-xxxx 3/3 Running 0 2m
prometheus-kube-prometheus-operator-xxxx 1/1 Running 0 2m
prometheus-kube-prometheus-prometheus-0 2/2 Running 0 2m
prometheus-kube-state-metrics-xxxx 1/1 Running 0 2m
Find the serviceMonitorSelector/ruleSelector labels that Prometheus uses to pick up ServiceMonitor/PrometheusRule objects — this is the release: prometheus label used throughout this tutorial.
$ kubectl get prometheus -n monitoring -o jsonpath='{.items[0].spec.ruleSelector}'
{"matchLabels":{"release":"prometheus"}}
$ kubectl get prometheus -n monitoring -o jsonpath='{.items[0].spec.serviceMonitorSelector}'
{"matchLabels":{"release":"prometheus"}}
Step 2: Install Panopticon (required for the Provisioner Group alerts)
Panopticon is the Appscode operator that exports the KubeDB operator’s own view of every resource — kubedb_com_mysql_status_phase and related metrics. It’s what powers the Provisioner Group alerts below (KubeDBMySQLPhaseNotReady/KubeDBMySQLPhaseCritical). Skip this step if you only need the exporter-based Database Group alerts.
$ helm repo add appscode https://charts.appscode.com/stable/
$ helm repo update
$ helm upgrade --install panopticon appscode/panopticon \
--version v2026.4.30 \
--namespace kubeops --create-namespace \
--set monitoring.enabled=true \
--set monitoring.agent=prometheus.io/operator \
--set monitoring.serviceMonitor.labels.release=prometheus \
--set-file license=/path/to/kubedb-license.txt \
--wait --timeout 5m0s
Verify Panopticon is running:
$ kubectl get pods -n kubeops
NAME READY STATUS RESTARTS AGE
panopticon-xxxx 1/1 Running 0 1m
Overview
The diagram below shows the full alerting architecture — from MySQL metric export through to alert delivery and Grafana visualisation.
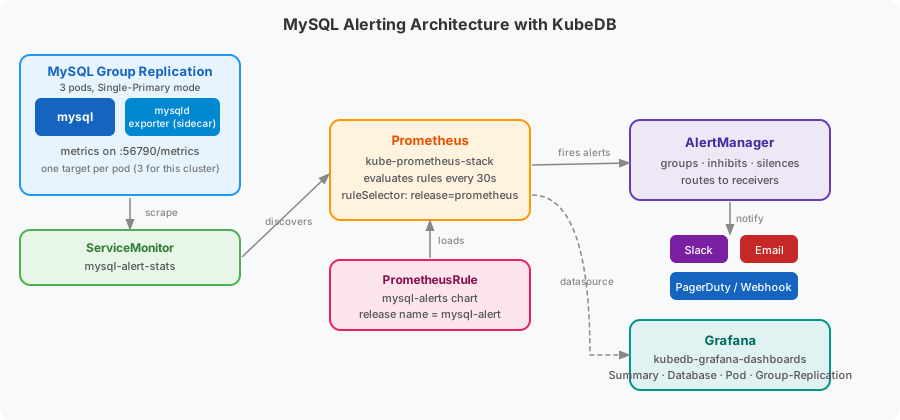
- KubeDB deploys MySQL with a built-in
mysqld_exportersidecar (container nameexporter) that exposes metrics on port56790. - ServiceMonitor (named
{mysql-name}-stats) is created automatically by KubeDB and tells Prometheus to scrape the exporter every 10 seconds. - PrometheusRule is created by the
mysql-alertschart and contains all MySQL alert definitions grouped by concern: database health, group replication, provisioner, ops-manager, and backups (Stash and KubeStash). - Prometheus Operator evaluates every rule expression every 30 seconds and fires matching alerts to AlertManager.
- AlertManager groups, inhibits, and silences alerts, then routes them to configured receivers (Slack, email, PagerDuty, webhook, etc.).
- Grafana visualises metrics through pre-built dashboards provisioned by the
kubedb-grafana-dashboardschart.
Deploy MySQL with Monitoring Enabled
At first, let’s deploy a MySQL database with monitoring enabled. This tutorial uses a 3-node Group Replication cluster (Single-Primary mode) rather than a standalone instance, since that’s representative of a real deployment and is what the rest of this guide’s screenshots are taken from — the group alert group only produces real data on a Group Replication topology; a standalone instance simply leaves it permanently INACTIVE with no series at all. spec.storage.storageClassName is set to longhorn so each node’s data volume is backed by Longhorn-replicated block storage rather than node-local storage.
apiVersion: kubedb.com/v1
kind: MySQL
metadata:
name: mysql-alert
namespace: alert-mysql
spec:
version: "9.7.1"
deletionPolicy: WipeOut
replicas: 3
topology:
mode: GroupReplication
group:
mode: Single-Primary
storageType: Durable
storage:
storageClassName: "longhorn"
accessModes:
- ReadWriteOnce
resources:
requests:
storage: 1Gi
monitor:
agent: prometheus.io/operator
prometheus:
serviceMonitor:
labels:
release: prometheus
interval: 10s
Here,
spec.storage.storageClassName: "longhorn"provisions the data volume from thelonghornStorageClassinstead of the defaultlocal-path, giving the volume replicated, node-independent storage.spec.monitor.agent: prometheus.io/operatortells KubeDB to create aServiceMonitorresource managed by the Prometheus operator.spec.monitor.prometheus.serviceMonitor.labels.release: prometheusadds therelease: prometheuslabel to the createdServiceMonitor, matching the PrometheusserviceMonitorSelectorso the target is discovered automatically.
Let’s create the namespace and the MySQL resource.
$ kubectl create ns alert-mysql
namespace/alert-mysql created
$ kubectl apply -f https://github.com/kubedb/docs/raw/v2026.7.10/docs/examples/mysql/monitoring/mysql-alert.yaml
mysql.kubedb.com/mysql-alert created
Now, wait for the database to go into Ready state.
$ kubectl get mysql -n alert-mysql mysql-alert
NAME          VERSION   STATUS   AGE
mysql-alert   9.6.0     Ready    28m
KubeDB brings up 3 Group Replication pods:
$ kubectl get pods -n alert-mysql
NAME            READY   STATUS    RESTARTS   AGE
mysql-alert-0   3/3     Running   0          28m
mysql-alert-1   3/3     Running   0          24m
mysql-alert-2   3/3     Running   0          24m
Confirm each data volume is actually Bound on the longhorn StorageClass.
$ kubectl get pvc -n alert-mysql
NAME                 STATUS   VOLUME                                     CAPACITY   ACCESS MODES   STORAGECLASS   AGE
data-mysql-alert-0   Bound    pvc-97cac013-9493-4943-9ec0-6f571878f0f2   1Gi        RWO            longhorn       28m
data-mysql-alert-1   Bound    pvc-93dfb146-0e3f-4860-b347-404b88a3ce95   1Gi        RWO            longhorn       24m
data-mysql-alert-2   Bound    pvc-177aee56-529b-4d07-92c8-48bfab3abf10   1Gi        RWO            longhorn       24m
KubeDB creates a dedicated stats service with the -stats suffix for monitoring.
$ kubectl get svc -n alert-mysql --selector="app.kubernetes.io/instance=mysql-alert"
NAME                 TYPE        CLUSTER-IP      EXTERNAL-IP   PORT(S)     AGE
mysql-alert          ClusterIP   10.43.62.19     <none>        3306/TCP    28m
mysql-alert-pods     ClusterIP   None            <none>        3306/TCP    28m
mysql-alert-standby  ClusterIP   10.43.44.245    <none>        3306/TCP    28m
mysql-alert-stats    ClusterIP   10.43.241.184   <none>        56790/TCP   28m
KubeDB also creates a ServiceMonitor that tells Prometheus where to scrape.
$ kubectl get servicemonitor -n alert-mysql
NAME                AGE
mysql-alert-stats   28m
Verify that the ServiceMonitor carries the release: prometheus label so Prometheus discovers it.
$ kubectl get servicemonitor -n alert-mysql mysql-alert-stats \
    -o jsonpath='{.metadata.labels.release}'
prometheus
Step 1 — Install mysql-alerts
The mysql-alerts chart creates a PrometheusRule resource containing all MySQL alert definitions grouped by concern: database health, group replication, provisioner, ops-manager, and backups (Stash / KubeStash).
Why the Helm release name matters
The chart derives the PromQL job/instance scoping (and the PrometheusRule name) from the Helm release name, not from a values field — so the release name must match the MySQL object’s name (mysql-alert) for the rules to be correctly scoped to this instance.
The chart’s default label is release: kube-prometheus-stack, so we must also override it at install time to match the Prometheus ruleSelector.
Install
$ helm upgrade -i mysql-alert oci://ghcr.io/appscode-charts/mysql-alerts \
    -n alert-mysql \
    --create-namespace \
    --version=v2026.7.14 \
    --set form.alert.labels.release=prometheus \
    --set form.alert.appSuffix=my-grafana-demo
| Flag | Value | Purpose |
|---|---|---|
mysql-alert (release name) | — | Scopes every PromQL expression to this instance (job="mysql-alert-stats") |
-n alert-mysql | alert-mysql | Installs the PrometheusRule in the same namespace as the database |
form.alert.labels.release | prometheus | Matches the Prometheus ruleSelector so the rules are loaded |
Verify the PrometheusRule is created
$ kubectl get prometheusrule -n alert-mysql
NAME                      AGE
mysql-alert   30s
Confirm the release: prometheus label is present.
$ kubectl get prometheusrule -n alert-mysql mysql-alert \
    -o jsonpath='{.metadata.labels.release}'
prometheus
Confirm Prometheus loaded the rules
Port-forward the Prometheus UI.
$ kubectl port-forward -n monitoring \
    svc/prometheus-kube-prometheus-prometheus 9090:9090
Open http://localhost:9090/rules and search for mysql-alert.
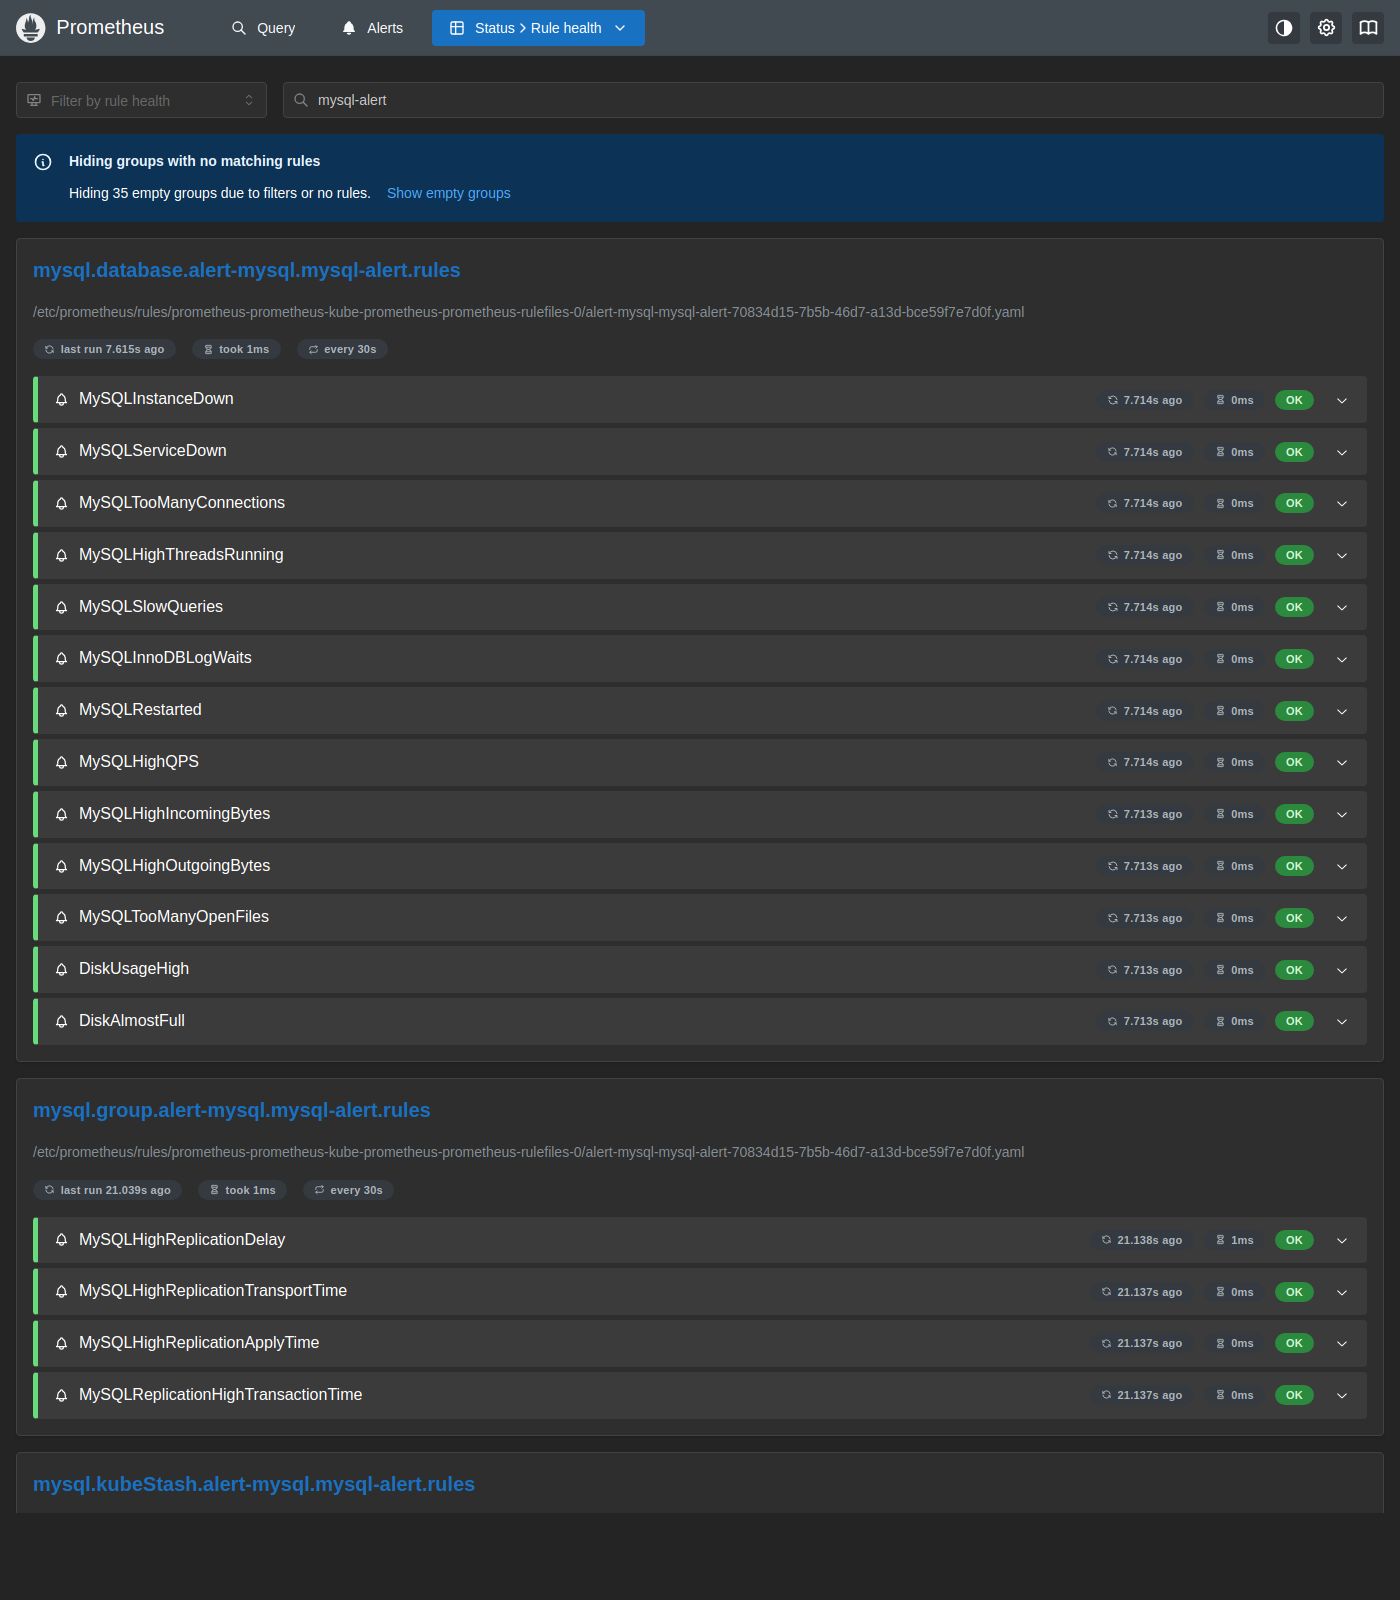
The mysql.database.alert-mysql.mysql-alert.rules group (and the accompanying mysql.group, mysql.provisioner, mysql.opsManager, mysql.stash, mysql.kubeStash, and mysql.schemaManager groups) are visible with all rules showing OK, confirming that Prometheus has loaded and is evaluating the MySQL alert definitions every 30 seconds.
Step 2 — Install kubedb-grafana-dashboards
The kubedb-grafana-dashboards chart creates GrafanaDashboard CRDs containing pre-built MySQL dashboard JSON. A separate controller, grafana-operator, watches these CRDs and pushes the dashboards into Grafana over its HTTP API — both pieces are required. If you’ve already set these up for another database on this cluster (see the Elasticsearch alerting guide for the full walkthrough), skip straight to Install the dashboards below.
Install grafana-operator
If your cluster doesn’t already have it (check with kubectl get crd grafanadashboards.openviz.dev):
$ helm upgrade -i grafana-operator appscode/grafana-operator \
    -n kubeops --create-namespace \
    --version=v2026.6.12 \
    --wait
Mark your Grafana instance as the cluster default
Skip this if you already have a Grafana AppBinding annotated as the cluster default (one is shared across every database). Otherwise:
$ kubectl port-forward -n monitoring svc/prometheus-grafana 3000:80&
$ GRAFANA_PW=$(kubectl get secret -n monitoring prometheus-grafana -o jsonpath='{.data.admin-password}' | base64 -d)
$ curl -s -X POST -H "Content-Type: application/json" -u admin:$GRAFANA_PW \
    http://localhost:3000/api/auth/keys \
    -d '{"name":"kubedb-dashboards","role":"Admin"}'
# Note the returned "key"
$ kill %1
# grafana-appbinding.yaml
apiVersion: v1
kind: Secret
metadata:
  name: grafana-admin-token
  namespace: kubeops
type: Opaque
stringData:
  token: "<api-key-from-above>"
---
apiVersion: appcatalog.appscode.com/v1alpha1
kind: AppBinding
metadata:
  name: grafana
  namespace: kubeops
  annotations:
    monitoring.appscode.com/is-default-grafana: "true"   # must be an ANNOTATION, not a label
spec:
  type: monitoring.appscode.com/grafana
  clientConfig:
    url: "http://prometheus-grafana.monitoring.svc:80"
  secret:
    name: grafana-admin-token
$ kubectl apply -f grafana-appbinding.yaml
Install the dashboards
$ helm repo add appscode https://charts.appscode.com/stable/
$ helm repo update appscode

$ helm template kubedb-grafana-dashboards appscode/kubedb-grafana-dashboards \
    -n kubeops \
    --version=v2026.7.10 \
    --set featureGates.MySQL=true \
    --set grafana.url="http://prometheus-grafana.monitoring.svc:80" \
    --set grafana.apikey="<api-key-from-above>" \
  | kubectl apply -n kubeops -f -
Note:
featureGates.<DB>defaults totruefor almost every database in this chart, so onehelm template | kubectl applyinstalls dashboards for many databases at once, not just MySQL — this is expected.
Verify dashboards are created
$ kubectl get grafanadashboards -n kubeops | grep mysql
NAME                                      TITLE                                         STATUS    AGE
kubedb-mysql-database                     KubeDB / MySQL / Database                    Current   2m
kubedb-mysql-group-replication-summary    KubeDB / MySQL / Group-Replication-Summary   Current   2m
kubedb-mysql-pod                          KubeDB / MySQL / Pod                         Current   2m
kubedb-mysql-summary                      KubeDB / MySQL / Summary                     Current   2m
Four dashboards this time, not three — MySQL’s chart ships a dedicated Group-Replication-Summary dashboard alongside the usual Summary/Pod/Database triplet.
Verify End-to-End
1. Check the exporter is running
The exporter sidecar inside the MySQL pod serves metrics at :56790/metrics. A value of mysql_up 1 confirms the exporter can reach MySQL.
$ kubectl exec -n alert-mysql mysql-alert-0 -c exporter -- \
    wget -qO- localhost:56790/metrics | grep mysql_up
mysql_up 1
2. Check the Prometheus target is UP
Prometheus discovers more than 20 scrape pools on a shared cluster, so instead of the Target health page, query up directly for a reliable view.
Open http://localhost:9090/query?g0.expr=up%7Bnamespace%3D%22alert-mysql%22%7D&g0.tab=1.
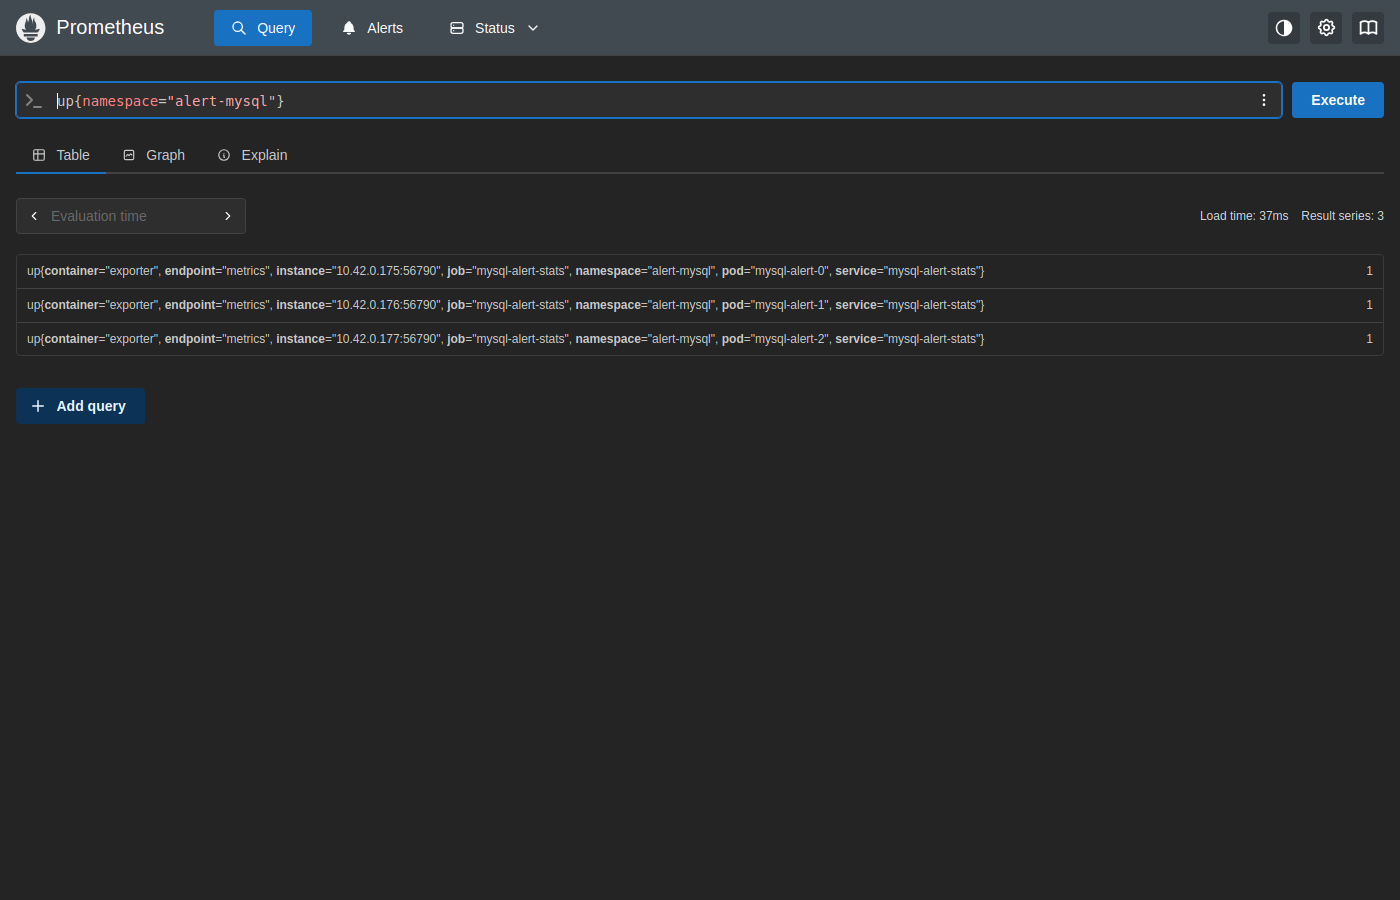
The target reports up == 1 for all 3 pods (mysql-alert-0/1/2) in the alert-mysql namespace, confirming Prometheus is scraping the exporter on every longhorn-backed pod.
3. Confirm all MySQL alerts are inactive
Open http://localhost:9090/alerts?search=mysql-alert and locate the mysql-alert groups.
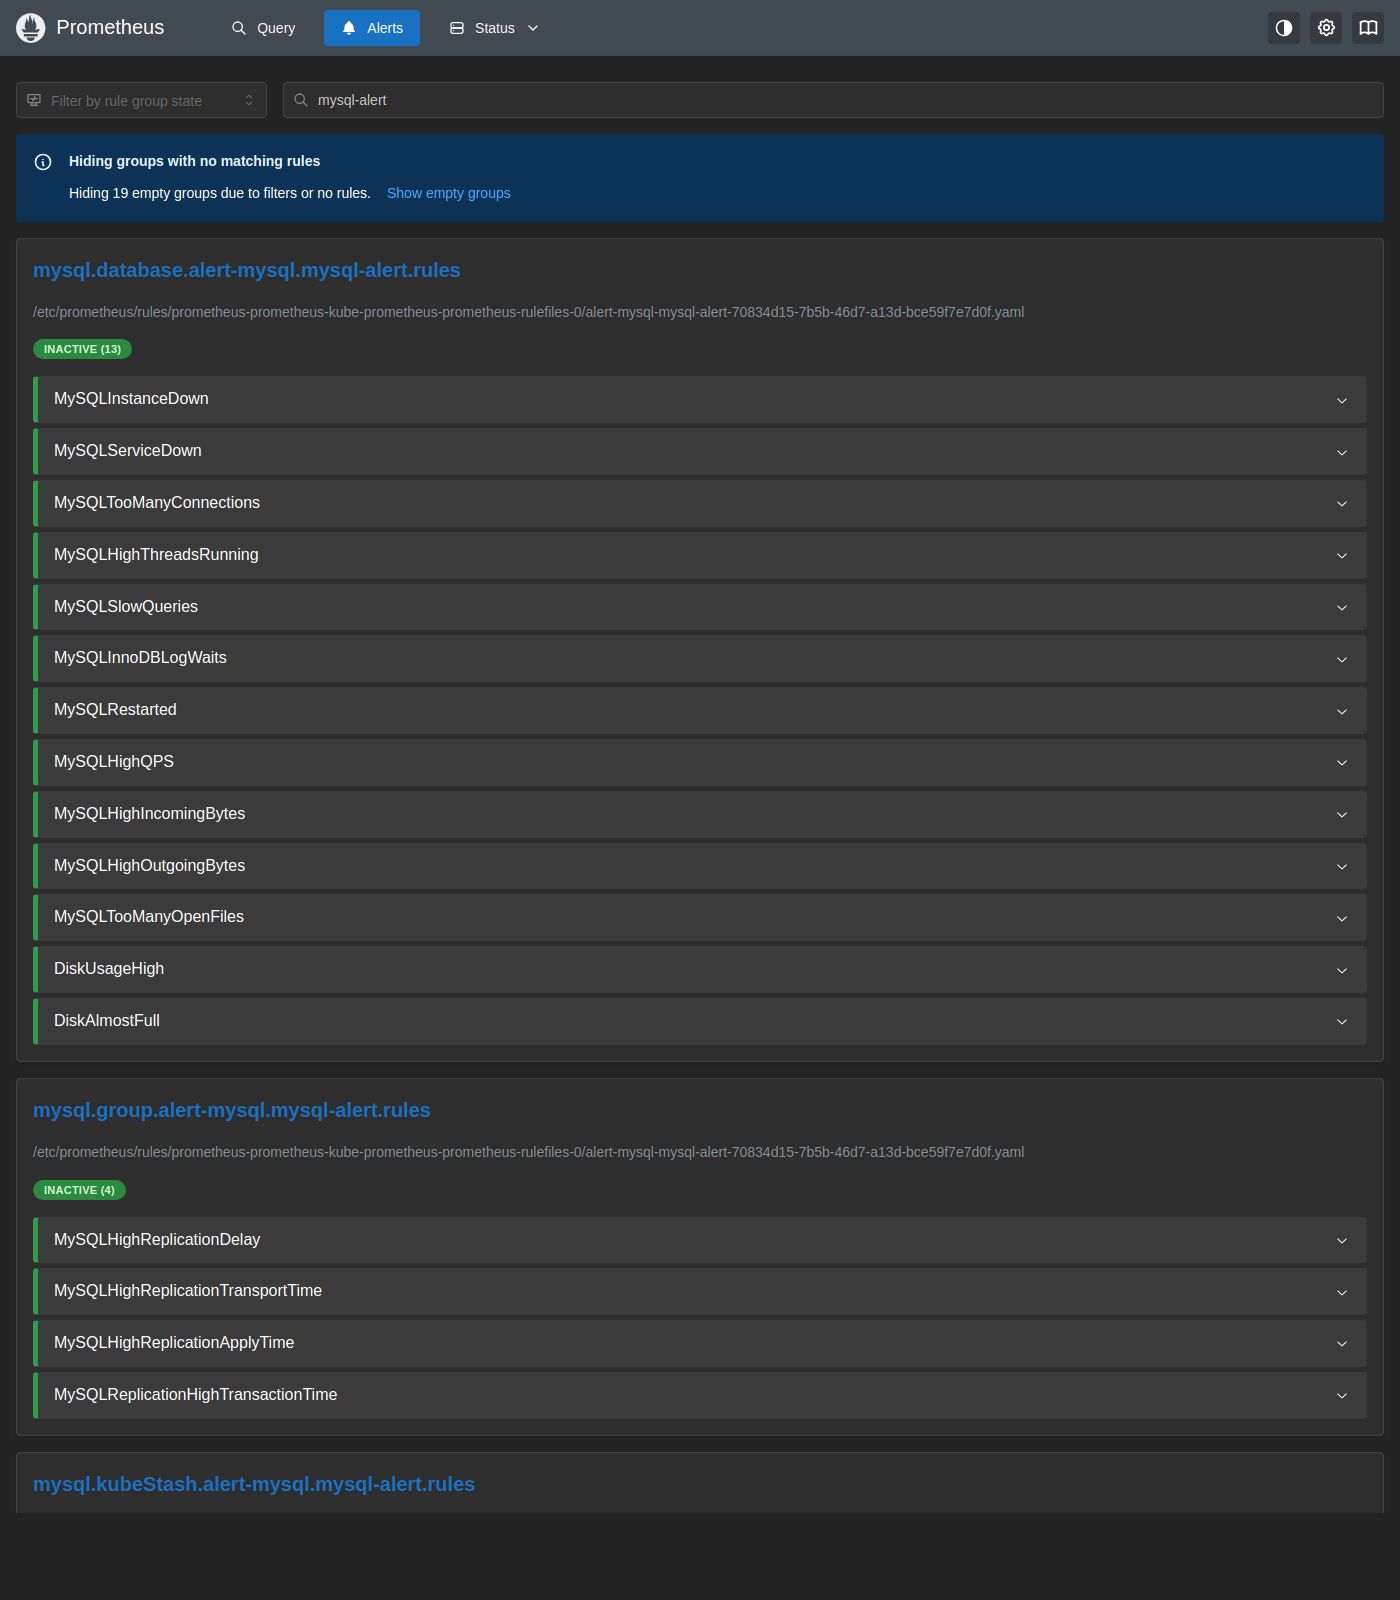
All 13 rules in the mysql.database group show INACTIVE (13), meaning the database is healthy and no thresholds are breached. This also confirms DiskUsageHigh/DiskAlmostFull are inactive — this chart’s disk-usage PromQL correctly divides against kubelet_volume_stats_capacity_bytes, so (unlike some other *-alerts charts) it does not falsely fire on a healthy volume regardless of storage backend. The mysql.group group’s 4 rules are also INACTIVE — on this real Group Replication cluster they have live data (unlike a standalone instance, where they’d have none at all), just currently below threshold.
4. Check AlertManager
Port-forward AlertManager to view any currently firing alerts.
$ kubectl port-forward -n monitoring \
    svc/prometheus-kube-prometheus-alertmanager 9093:9093
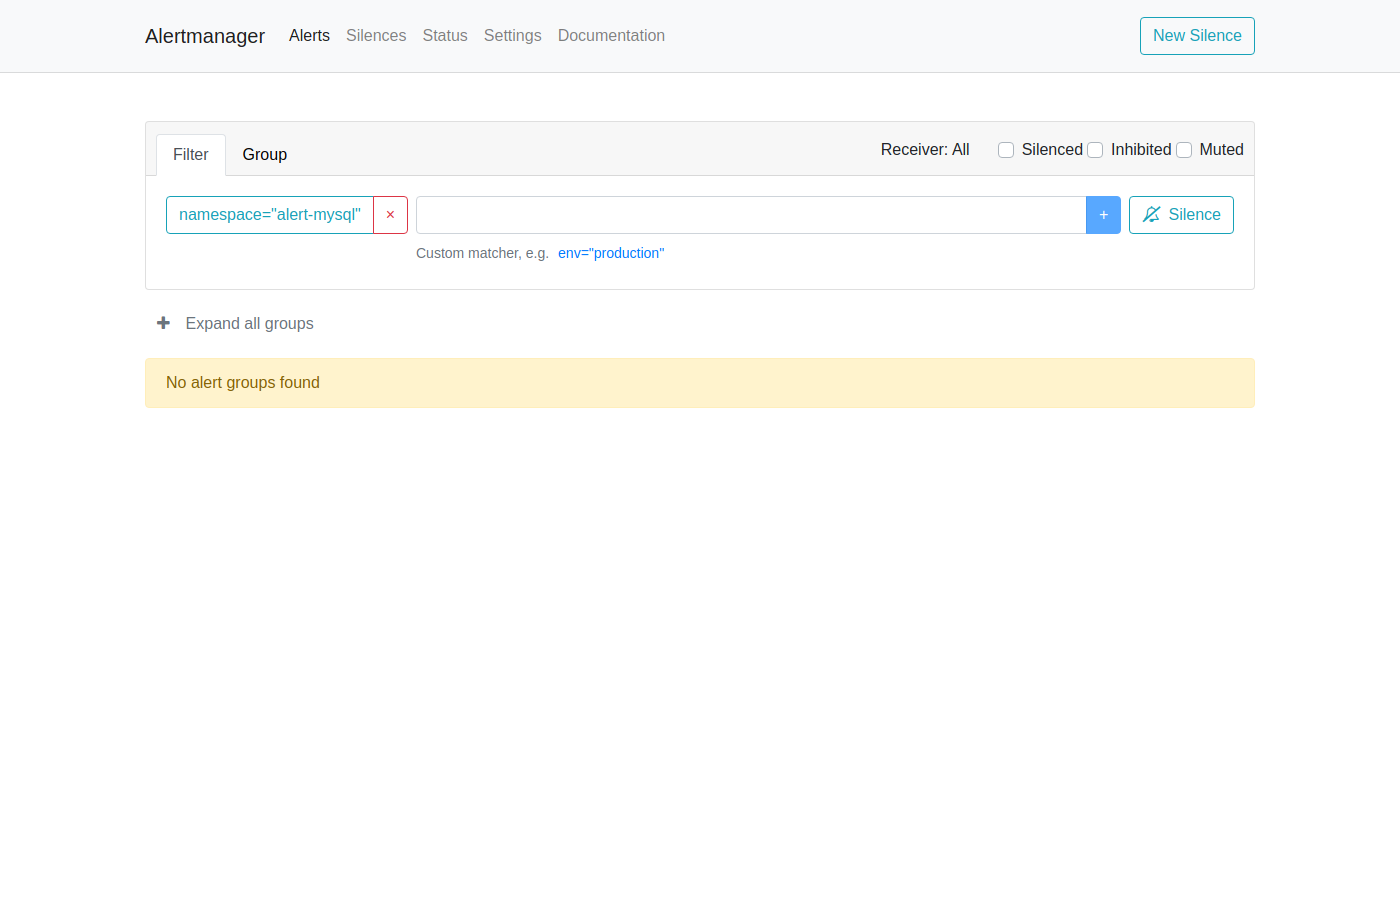
Open http://localhost:9093. With a healthy MySQL instance, no alerts for mysql-alert will be listed here.
Simulating a Firing Alert
The previous section confirmed that all alerts are INACTIVE while the database is healthy. This section walks through deliberately triggering the MySQLInstanceDown critical alert on one node so you can observe the full alert lifecycle — from firing in Prometheus through to the AlertManager dashboard — and then resolve it.
The exporter sidecar runs as a separate container from mysql, so it keeps running even after mysqld crashes, and the pod’s PID 1 is tini (not mysqld itself) — killing just the mysqld process doesn’t take the container down, unlike killing PID 1 would. A single kill self-heals in well under 10 seconds though (the wrapper notices and respawns it), so hold it down with a short kill-loop to reliably catch it on a scrape.
1. Crash the MySQL process on one node
$ kubectl exec -n alert-mysql mysql-alert-0 -c mysql -- sh -c '
    end=$(( $(date +%s) + 45 ));
    while [ $(date +%s) -lt $end ]; do
      for p in /proc/[0-9]*; do
        pid=$(basename $p)
        if [ -r $p/comm ] && [ "$(cat $p/comm 2>/dev/null)" = "mysqld" ]; then
          kill -9 $pid 2>/dev/null
        fi
      done
      sleep 1
    done'
(The image has no pgrep/ps, so the loop scans /proc directly to find the mysqld PID each iteration.) Run this in the background — it holds mysqld down on mysql-alert-0 for 45 seconds, comfortably past one scrape (10s) and evaluation (30s) cycle.
2. Watch the alert fire in Prometheus
Open http://localhost:9090/alerts?search=mysql-alert.
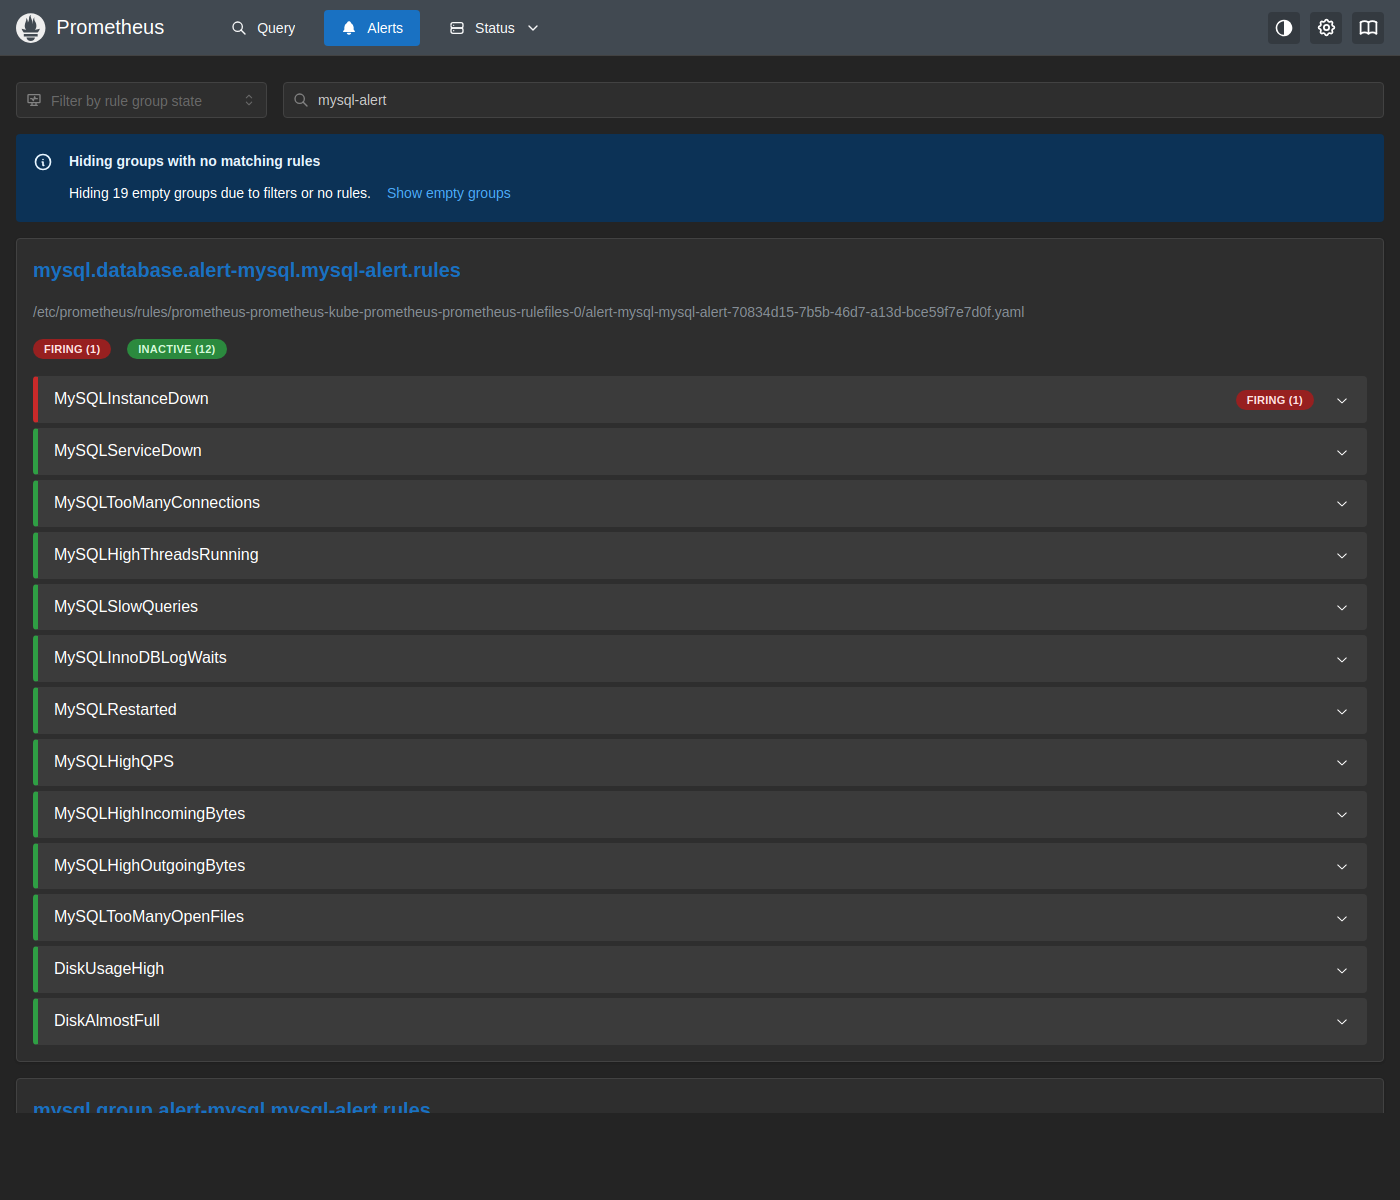
MySQLInstanceDown transitions from INACTIVE to FIRING as soon as the exporter on mysql-alert-0 reports mysql_up == 0 — it has for: 0m, so it fires on the very next evaluation cycle. Note that MySQLServiceDown correctly stays INACTIVE here: that rule fires only when no pod behind the stats service reports mysql_up == 1, and mysql-alert-1/mysql-alert-2 are still healthy — a real distinction a single-node deployment wouldn’t show you.
3. Check the AlertManager dashboard
Open http://localhost:9093/#/alerts?filter={namespace="alert-mysql"}.
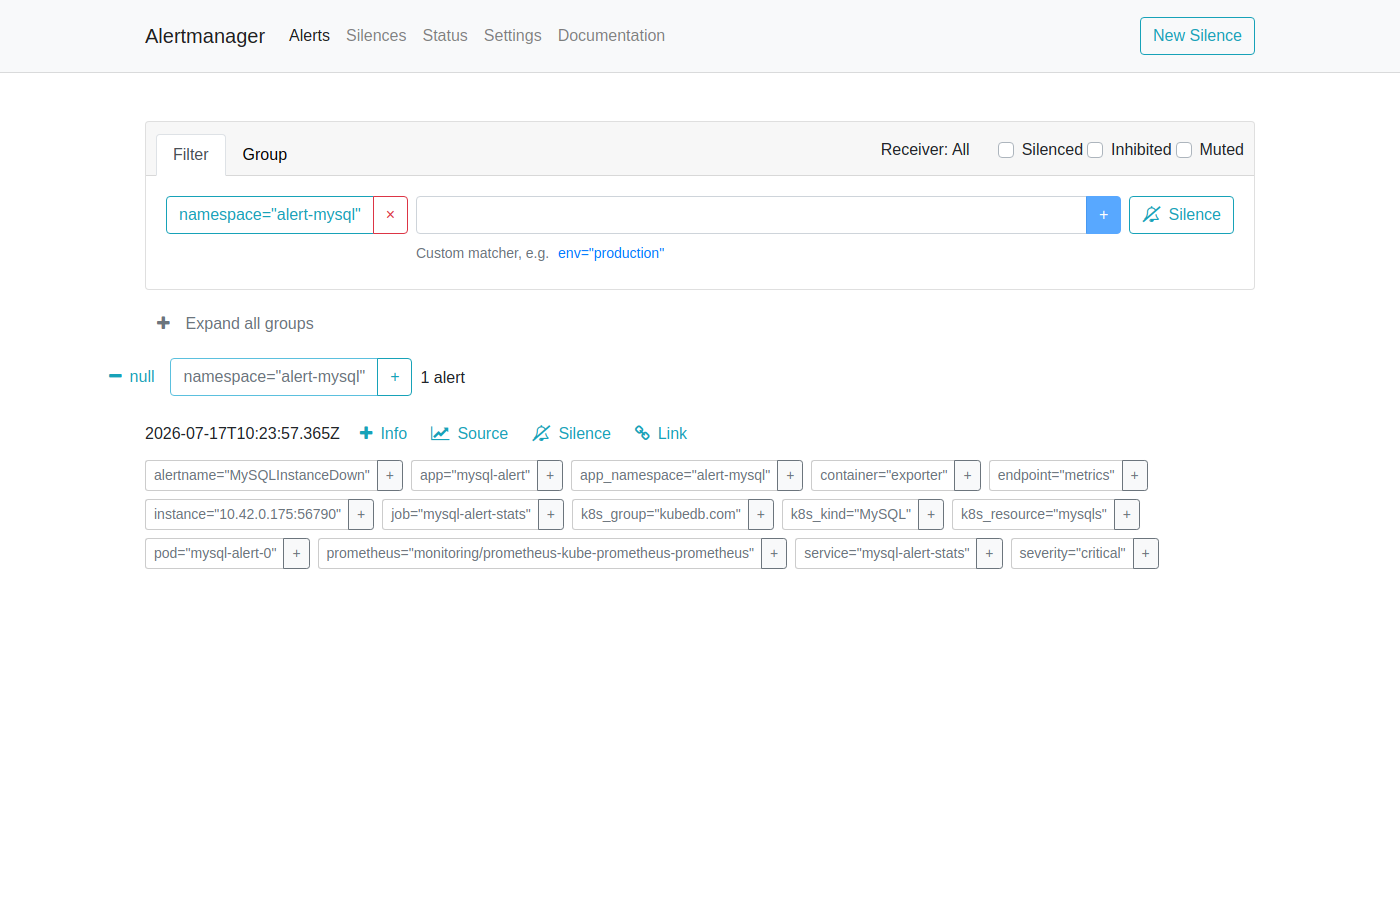
AlertManager shows the MySQLInstanceDown alert. The alert card displays:
- Severity:
critical - pod:
mysql-alert-0 - job:
mysql-alert-stats - Started: timestamp when the alert first fired
AlertManager routes this alert to every receiver configured in your alertmanagerConfig (Slack, email, PagerDuty, webhook, etc.) based on your routing tree. If no receiver is configured, the alert is visible here but silently dropped.
4. Restore MySQL
Let the loop from step 1 finish (or stop it early) — the wrapper script inside the container restarts mysqld on its own, no pod restart needed.
$ kubectl get pods -n alert-mysql
NAME            READY   STATUS    RESTARTS   AGE
mysql-alert-0   3/3     Running   0          29m
Recovery took about 60 seconds after the kill-loop ended in testing — mysqld restarts and rejoins Group Replication before mysql_up returns to 1. Expect a brief MySQLRestarted (uptime-based) alert and possibly a transient MySQLSlowQueries alert immediately afterward — both clear on their own within a couple of minutes and aren’t a sign anything is wrong. Once mysql_up is back to 1 and the resource phase returns to Ready, Prometheus marks MySQLInstanceDown INACTIVE and AlertManager sends a resolved notification.
Alert Reference
All alerts are scoped to the mysql-alert instance in the alert-mysql namespace via the PromQL label filters job="mysql-alert-stats" and namespace="alert-mysql" (database/group groups), or app="mysql-alert" and namespace="alert-mysql" (provisioner/opsManager/stash/kubeStash/schemaManager groups).
Database Group
Fired based on live metrics from mysqld_exporter.
| Alert | Severity | For | What It Means |
|---|---|---|---|
MySQLInstanceDown | critical | instant | Exporter cannot reach MySQL — instance is down or mysqld crashed. |
MySQLServiceDown | critical | instant | No pod behind the stats service reports mysql_up == 1 — the service has no healthy backend. |
MySQLTooManyConnections | warning | 2m | More than 80% of max_connections are in use — connection pool nearing exhaustion. |
MySQLHighThreadsRunning | warning | 2m | More than 60% of max_connections worth of threads are actively running — the server is under heavy load. |
MySQLSlowQueries | warning | 2m | New slow queries have been logged in the last minute. |
MySQLInnoDBLogWaits | warning | instant | InnoDB log writes are stalling (>10 waits in 15m) — I/O may be a bottleneck. |
MySQLRestarted | warning | instant | MySQL uptime is under 60 seconds — the server restarted recently. |
MySQLHighQPS | critical | instant | Queries per second exceed 1000 — unusually high query load. |
MySQLHighIncomingBytes | critical | instant | Incoming network traffic exceeds 1MB/s. |
MySQLHighOutgoingBytes | critical | instant | Outgoing network traffic exceeds 1MB/s. |
MySQLTooManyOpenFiles | warning | 2m | More than 80% of open_files_limit are in use. |
DiskUsageHigh | warning | 1m | Persistent volume usage exceeds 80% — plan for expansion. |
DiskAlmostFull | critical | 1m | Persistent volume usage exceeds 95% — MySQL may become read-only or crash. |
Group Replication Group
Fired based on MySQL Group Replication performance-schema metrics; only meaningful for clustered/group-replication deployments.
| Alert | Severity | For | What It Means |
|---|---|---|---|
MySQLHighReplicationDelay | warning | 5m | Group Replication apply time on a member exceeds 0.5s. |
MySQLHighReplicationTransportTime | warning | 5m | Group Replication transport time exceeds 0.5s — network lag between members. |
MySQLHighReplicationApplyTime | warning | 5m | Group Replication apply time exceeds 0.5s. |
MySQLReplicationHighTransactionTime | warning | 5m | Transaction time on the local relay queue exceeds 0.5s — the member is falling behind. |
Provisioner Group
Monitors the KubeDB operator’s view of the MySQL resource phase (sourced from Panopticon, not the MySQL metrics endpoint).
| Alert | Severity | For | What It Means |
|---|---|---|---|
KubeDBMySQLPhaseNotReady | critical | 1m | KubeDB marked the MySQL resource NotReady — operator cannot reach a healthy instance. |
KubeDBMySQLPhaseCritical | warning | 15m | The MySQL resource is in a degraded/critical phase. |
OpsManager Group
Tracks MySQLOpsRequest lifecycle during upgrades, scaling, reconfiguration, and certificate rotations.
| Alert | Severity | For | What It Means |
|---|---|---|---|
KubeDBMySQLOpsRequestStatusProgressingToLong | critical | 30m | A MySQLOpsRequest has been in progress for 30+ minutes — likely stuck. |
KubeDBMySQLOpsRequestFailed | critical | instant | A MySQLOpsRequest failed — check the MySQLOpsRequest object for the error. |
Stash Group
Tracks Stash-driven backup/restore health for this instance. (You do not need to configure backups to see these rules; they are included in the PrometheusRule regardless.)
| Alert | Severity | For | What It Means |
|---|---|---|---|
MySQLStashBackupSessionFailed | critical | instant | A Stash backup session failed. |
MySQLStashRestoreSessionFailed | critical | instant | A Stash restore session failed. |
MySQLStashNoBackupSessionForTooLong | warning | instant | No successful backup session for more than 18000s (5 hours). |
MySQLStashRepositoryCorrupted | critical | 5m | The Stash backup repository integrity check failed — repository is corrupted. |
MySQLStashRepositoryStorageRunningLow | warning | 5m | Backup repository storage size has exceeded 10GB. |
MySQLStashBackupSessionPeriodTooLong | warning | instant | A backup session took more than 1800s (30 minutes) to complete. |
MySQLStashRestoreSessionPeriodTooLong | warning | instant | A restore session took more than 1800s (30 minutes) to complete. |
KubeStash Group
Tracks KubeStash-driven backup/restore health for this instance. Same semantics as the Stash group above, sourced from KubeStash metrics instead.
| Alert | Severity | For | What It Means |
|---|---|---|---|
MySQLKubeStashBackupSessionFailed | critical | instant | A KubeStash backup session failed. |
MySQLKubeStashRestoreSessionFailed | critical | instant | A KubeStash restore session failed. |
MySQLKubeStashNoBackupSessionForTooLong | warning | instant | No successful backup session for more than 18000s (5 hours). |
MySQLKubeStashRepositoryCorrupted | critical | 5m | The KubeStash backup repository integrity check failed — repository is corrupted. |
MySQLKubeStashRepositoryStorageRunningLow | warning | 5m | Backup repository storage size has exceeded 10GB. |
MySQLKubeStashBackupSessionPeriodTooLong | warning | instant | A backup session took more than 1800s (30 minutes) to complete. |
MySQLKubeStashRestoreSessionPeriodTooLong | warning | instant | A restore session took more than 1800s (30 minutes) to complete. |
SchemaManager Group
Monitors MySQLDatabase schema lifecycle objects managed by KubeDB Schema Manager.
| Alert | Severity | For | What It Means |
|---|---|---|---|
KubeDBMySQLSchemaPendingForTooLong | warning | 30m | Schema object stuck in Pending — may be waiting on a dependency. |
KubeDBMySQLSchemaInProgressForTooLong | warning | 30m | Schema migration running for 30+ minutes — may be stuck. |
KubeDBMySQLSchemaTerminatingForTooLong | warning | 30m | Schema deletion stuck — a finalizer may be blocking it. |
KubeDBMySQLSchemaFailed | warning | instant | Schema operation failed. |
KubeDBMySQLSchemaExpired | warning | instant | A schema with a TTL has expired and been revoked. |
Customising Alerts
To override thresholds or disable specific alert groups, create a custom values file and upgrade the chart.
# custom-alerts.yaml
form:
  alert:
    labels:
      release: prometheus
    groups:
      database:
        enabled: warning
        rules:
          mysqlTooManyConnections:
            enabled: true
            duration: "5m"
            val: 90        # fire at 90% instead of the default 80%
            severity: warning
      opsManager:
        enabled: "none"    # disable all ops-manager alerts
$ helm upgrade mysql-alert oci://ghcr.io/appscode-charts/mysql-alerts \
    -n alert-mysql \
    --version=v2026.7.14 \
    -f custom-alerts.yaml
Cleaning up
To remove all resources created in this tutorial, run the following commands.
# Remove the Grafana dashboards (installed via helm template | kubectl apply, not helm install)
$ helm template kubedb-grafana-dashboards appscode/kubedb-grafana-dashboards \
    -n kubeops \
    --version=v2026.7.10 \
    --set featureGates.MySQL=true \
    --set grafana.url="http://prometheus-grafana.monitoring.svc:80" \
    --set grafana.apikey="<api-key>" \
  | kubectl delete -n kubeops -f - --ignore-not-found

# Remove the mysql-alerts release
$ helm uninstall mysql-alert -n alert-mysql

# Remove the MySQL instance
$ kubectl delete mysql -n alert-mysql mysql-alert

# Delete namespace
$ kubectl delete ns alert-mysql

# Optional: only if nothing else in the cluster depends on them
$ kubectl delete appbinding -n kubeops grafana
$ kubectl delete secret -n kubeops grafana-admin-token
$ helm uninstall grafana-operator -n kubeops

# Uninstall monitoring stack (optional — skip if other tutorials on this cluster still need them)
$ helm uninstall panopticon -n kubeops
$ helm uninstall prometheus -n monitoring
Next Steps
- Monitor your MySQL database with KubeDB using builtin Prometheus.
- Monitor your MySQL database with KubeDB using Prometheus operator.
- Detail concepts of MySQL object.
- Want to hack on KubeDB? Check our contribution guidelines.