








































New to KubeDB? Please start here.
MongoDB Alerting with Prometheus
This tutorial shows you how to configure Prometheus-based alerting for a KubeDB-managed MongoDB instance using the mongodb-alerts Helm chart. This chart also bundles a Grafana dashboard that it imports automatically through a post-install Job — no separate dashboard chart is required.
Before You Begin
Ensure you have a Kubernetes cluster and that
kubectlis configured to communicate with it. If you do not already have a cluster, you can create one using kind.Install the KubeDB operator by following the steps here.
Deploy the database in the
alert-mongodbnamespace:$ kubectl create ns alert-mongodb namespace/alert-mongodb createdTo learn more about how Prometheus monitoring works with KubeDB, see the overview here.
You will also need a Grafana API key / token with Editor permission so the chart’s dashboard-import Job can push the dashboard. See Step 1 below.
Note: YAML files used in this tutorial are stored in docs/examples/mongodb folder in GitHub repository kubedb/docs.
Configuration
Step 1 (
kube-prometheus-stack) is required to follow this tutorial. Step 2 (Panopticon) is required for the Provisioner Group alerts below (KubeDBMongoDBPhase...) — skip it only if you just want the exporter-based Database Group alerts. If you have already completed the step(s) you need in another guide, skip ahead.
Step 1: Deploy kube-prometheus-stack
kube-prometheus-stack installs Prometheus, Prometheus Operator, Alertmanager, and Grafana together. This is the recommended way to get the full monitoring stack on Kubernetes.
Add the prometheus-community Helm repo and install:
$ helm repo add prometheus-community https://prometheus-community.github.io/helm-charts
$ helm repo update

$ helm upgrade --install prometheus prometheus-community/kube-prometheus-stack \
  --namespace monitoring --create-namespace \
  --set grafana.image.tag=7.5.5
Wait for all pods to be ready:
$ kubectl get pods -n monitoring
NAME                                                   READY   STATUS    RESTARTS   AGE
alertmanager-prometheus-kube-prometheus-alertmanager-0 2/2     Running   0          2m
prometheus-grafana-xxxx                                3/3     Running   0          2m
prometheus-kube-prometheus-operator-xxxx               1/1     Running   0          2m
prometheus-kube-prometheus-prometheus-0                2/2     Running   0          2m
prometheus-kube-state-metrics-xxxx                     1/1     Running   0          2m
Find the serviceMonitorSelector/ruleSelector labels that Prometheus uses to pick up ServiceMonitor/PrometheusRule objects — this is the release: prometheus label used throughout this tutorial.
$ kubectl get prometheus -n monitoring -o jsonpath='{.items[0].spec.ruleSelector}'
{"matchLabels":{"release":"prometheus"}}

$ kubectl get prometheus -n monitoring -o jsonpath='{.items[0].spec.serviceMonitorSelector}'
{"matchLabels":{"release":"prometheus"}}
Step 2: Install Panopticon (required for the Provisioner Group alerts)
Panopticon is the Appscode operator that exports the KubeDB operator’s own view of every resource — kubedb_com_mongodb_status_phase and related metrics. It’s what powers the Provisioner Group alerts below (KubeDBMongoDBPhaseNotReady/KubeDBMongoDBPhaseCritical). Skip this step if you only need the exporter-based Database Group alerts.
$ helm repo add appscode https://charts.appscode.com/stable/
$ helm repo update

$ helm upgrade --install panopticon appscode/panopticon \
  --version v2026.4.30 \
  --namespace kubeops --create-namespace \
  --set monitoring.enabled=true \
  --set monitoring.agent=prometheus.io/operator \
  --set monitoring.serviceMonitor.labels.release=prometheus \
  --set-file license=/path/to/kubedb-license.txt \
  --wait --timeout 5m0s
Verify Panopticon is running:
$ kubectl get pods -n kubeops
NAME                          READY   STATUS    RESTARTS   AGE
panopticon-xxxx               1/1     Running   0          1m
Overview

- KubeDB deploys MongoDB with a
mongodb_exportersidecar (containerexporter) that exposes metrics (mongodb_*). - ServiceMonitor (named
{mongodb-name}-stats) is created automatically by KubeDB and tells Prometheus to scrape the exporter every 10 seconds. - PrometheusRule is created by the
mongodb-alertschart and contains MongoDB alert definitions grouped by concern: database health (which also embeds the KubeDB-operator-sourcedMongoDBDown/MongoDBPhaseCriticalpair), provisioner, ops-manager, Stash backup/restore, KubeStash backup/restore, and schema manager. - Dashboard-import Job — when
grafana.enabledistrue, the chart also creates a one-shotJobthatPOSTs a bundled dashboard JSON straight to your Grafana instance’s/api/dashboards/importendpoint. - Prometheus Operator evaluates every rule expression every 30 seconds and fires matching alerts to AlertManager.
- AlertManager groups, inhibits, and silences alerts, then routes them to configured receivers (Slack, email, PagerDuty, webhook, etc.).
Deploy MongoDB with Monitoring Enabled
At first, let’s deploy a 3-member MongoDB replica set with monitoring enabled. Below is the MongoDB object we are going to create.
apiVersion: kubedb.com/v1
kind: MongoDB
metadata:
  name: mongodb-alert-demo
  namespace: alert-mongodb
spec:
  version: "8.0.17"
  replicaSet:
    name: "rs1"
  replicas: 3
  storageType: Durable
  storage:
    storageClassName: "local-path"
    accessModes:
      - ReadWriteOnce
    resources:
      requests:
        storage: 1Gi
  deletionPolicy: WipeOut
  monitor:
    agent: prometheus.io/operator
    prometheus:
      serviceMonitor:
        labels:
          release: prometheus
        interval: 10s
Here,
spec.replicaSet.name: "rs1"andspec.replicas: 3create a 3-member MongoDB replica set.spec.monitor.agent: prometheus.io/operatortells KubeDB to create aServiceMonitorresource managed by the Prometheus operator.spec.monitor.prometheus.serviceMonitor.labels.release: prometheusadds therelease: prometheuslabel to the createdServiceMonitor, matching the PrometheusserviceMonitorSelectorso the target is discovered automatically.
Let’s create the MongoDB resource.
$ kubectl apply -f https://github.com/kubedb/docs/raw/v2026.7.10/docs/examples/mongodb/monitoring/mongodb-alert-demo.yaml
mongodb.kubedb.com/mongodb-alert-demo created
Wait for the database to go into Ready state.
$ kubectl get mongodb -n alert-mongodb mongodb-alert-demo
NAME                 VERSION   STATUS   AGE
mongodb-alert-demo   8.0.17    Ready    3m
KubeDB creates a dedicated stats service with the -stats suffix for monitoring.
$ kubectl get svc -n alert-mongodb --selector="app.kubernetes.io/instance=mongodb-alert-demo"
NAME                        TYPE        CLUSTER-IP     EXTERNAL-IP   PORT(S)     AGE
mongodb-alert-demo          ClusterIP   10.43.10.20    <none>        27017/TCP   3m
mongodb-alert-demo-pods     ClusterIP   None           <none>        27017/TCP   3m
mongodb-alert-demo-stats    ClusterIP   10.43.10.21    <none>        56790/TCP   3m
KubeDB also creates a ServiceMonitor that tells Prometheus where to scrape.
$ kubectl get servicemonitor -n alert-mongodb
NAME                     AGE
mongodb-alert-demo-stats 3m
Verify that the ServiceMonitor carries the release: prometheus label so Prometheus discovers it.
$ kubectl get servicemonitor -n alert-mongodb mongodb-alert-demo-stats \
    -o jsonpath='{.metadata.labels.release}'
prometheus
Step 1 — Create a Grafana API Key
The chart’s dashboard-import Job authenticates to Grafana with a bearer token, so create one first.
Grafana 9+: Administration → Service accounts → Add service account → role Editor → Add token. Copy the token.
Grafana 8.x and earlier (no Service Accounts UI, e.g. the bundled
kube-prometheus-stackGrafana 7.5.5): use the legacy API Keys endpoint instead:# Port-forward Grafana $ kubectl port-forward -n monitoring svc/prometheus-grafana 3000:80& # Retrieve the admin password $ kubectl get secret -n monitoring prometheus-grafana \ -o jsonpath='{.data.admin-password}' | base64 -d && echo # Create an API key with Editor role $ curl -s -X POST -H "Content-Type: application/json" \ -u admin:<grafana_password> \ http://localhost:3000/api/auth/keys \ -d '{"name":"mongodb-alerts-demo","role":"Editor"}' # Note the returned "key" # Stop the port-forward $ kill %1
Either way, you end up with a bearer token to use as grafana.apikey below.
Step 2 — Install mongodb-alerts
Why the Helm release name matters
The chart derives the PrometheusRule name and scopes every PromQL expression (via job="{release-name}-stats" / app="{release-name}") from the Helm release name — so the release name must match the MongoDB object’s name (mongodb-alert-demo).
Install
Disk-usage alerts are disabled for this tutorial; MongoDB’s other resource and health alerts provide sufficient coverage.
$ helm upgrade -i mongodb-alert-demo oci://ghcr.io/appscode-charts/mongodb-alerts \
    -n alert-mongodb \
    --create-namespace \
    --version=v2026.7.14 \
    --set form.alert.labels.release=prometheus \
    --set grafana.enabled=true \
    --set grafana.url="http://prometheus-grafana.monitoring.svc:80" \
    --set grafana.apikey="<token-from-above>" \
    --set grafana.jobName=mongodb-alert-demo-stats \
    --set form.alert.appSuffix=mg-grafana-demo
| Flag | Value | Purpose |
|---|---|---|
grafana.url | in-cluster Grafana URL | The dashboard-import Job runs inside the cluster, so this must be a cluster-internal address, not localhost |
grafana.apikey | token from Step 1 | Authenticates the dashboard-import POST request |
grafana.jobName | mongodb-alert-demo-stats | Required — the chart’s default (kubedb-databases) doesn’t match any real Prometheus job, so most of the dashboard’s panels show “No data” unless you override it to your instance’s actual stats-service name |
To install alerts only, without the dashboard, omit the
grafana.*flags (or set--set grafana.enabled=false).
Verify the PrometheusRule is created
$ kubectl get prometheusrule -n alert-mongodb
NAME                 AGE
mongodb-alert-demo   30s
Confirm the release: prometheus label is present.
$ kubectl get prometheusrule -n alert-mongodb mongodb-alert-demo \
    -o jsonpath='{.metadata.labels.release}'
prometheus
Verify the dashboard-import Job
$ kubectl get job -n alert-mongodb
NAME                          STATUS     COMPLETIONS   AGE
mongodb-alert-demo-post-job   Complete   1/1           17s

$ kubectl logs -n alert-mongodb job/mongodb-alert-demo-post-job
{"pluginId":"","title":"kubedb.com / MongoDB / alert-mongodb / mongodb-alert-demo","imported":true, ...}
A "imported":true response confirms the dashboard kubedb.com / MongoDB / alert-mongodb / mongodb-alert-demo now exists in Grafana.
Confirm Prometheus loaded the rules
$ kubectl port-forward -n monitoring \
    svc/prometheus-kube-prometheus-prometheus 9090:9090
Open http://localhost:9090/rules and locate the mongodb.database, mongodb.provisioner, mongodb.opsManager, mongodb.stash, mongodb.kubeStash, and mongodb.schemaManager groups.
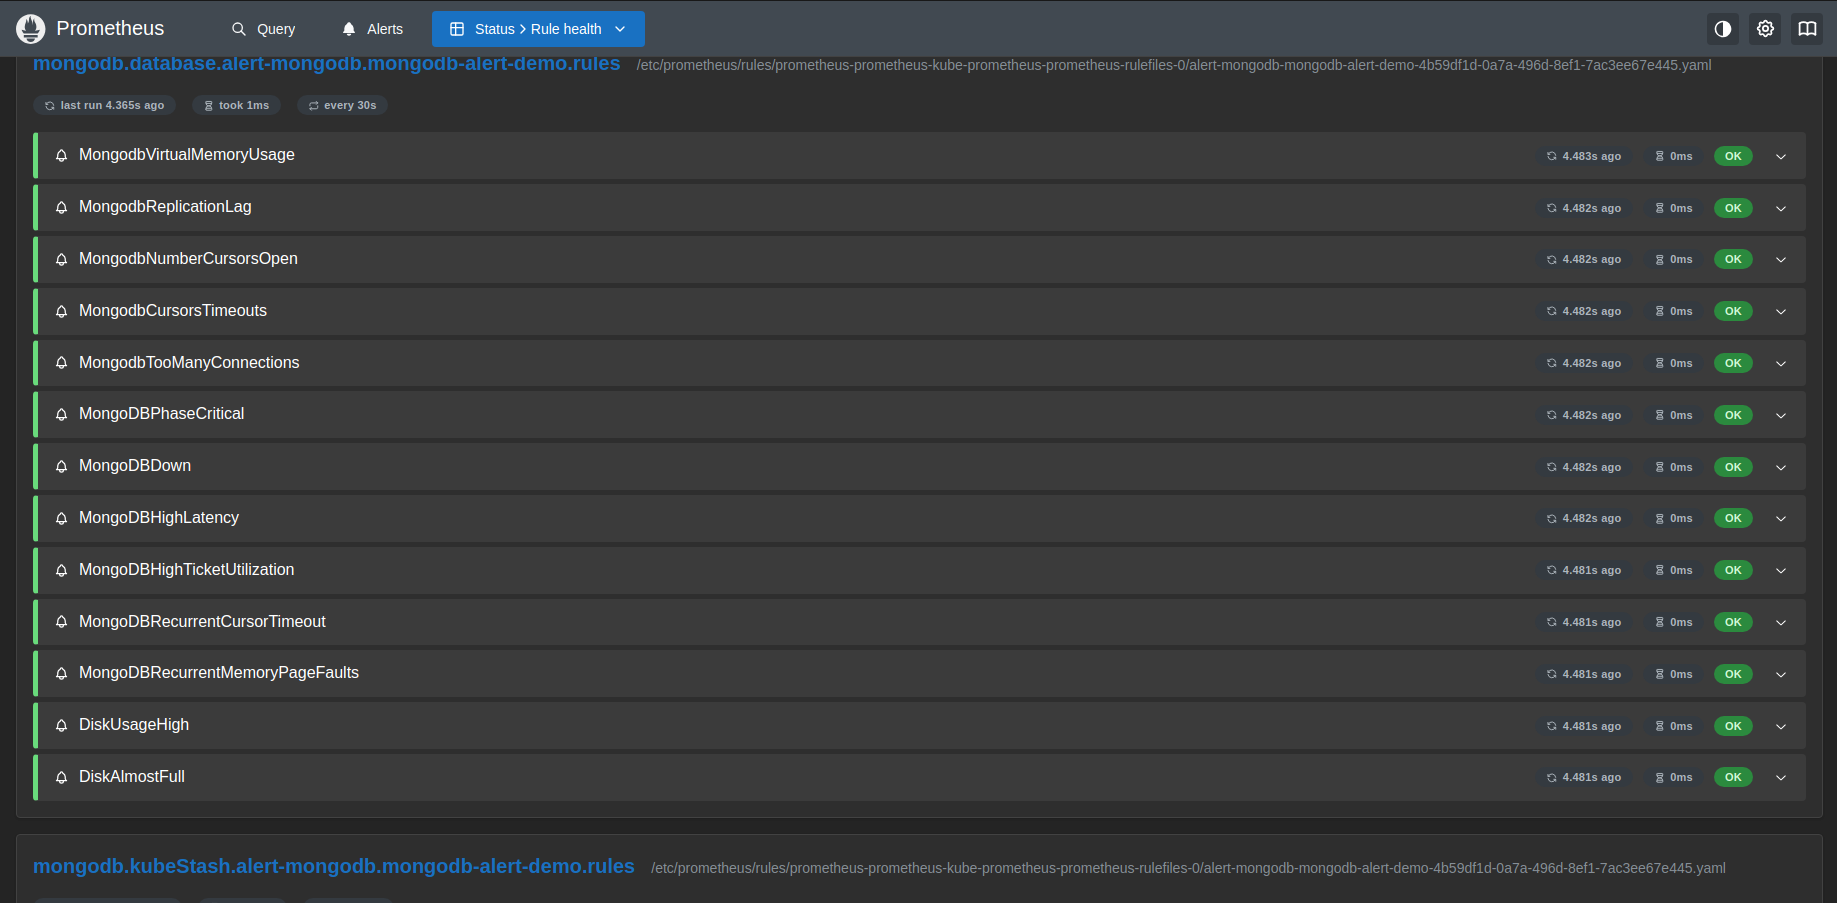
All groups should show OK.
Verify End-to-End
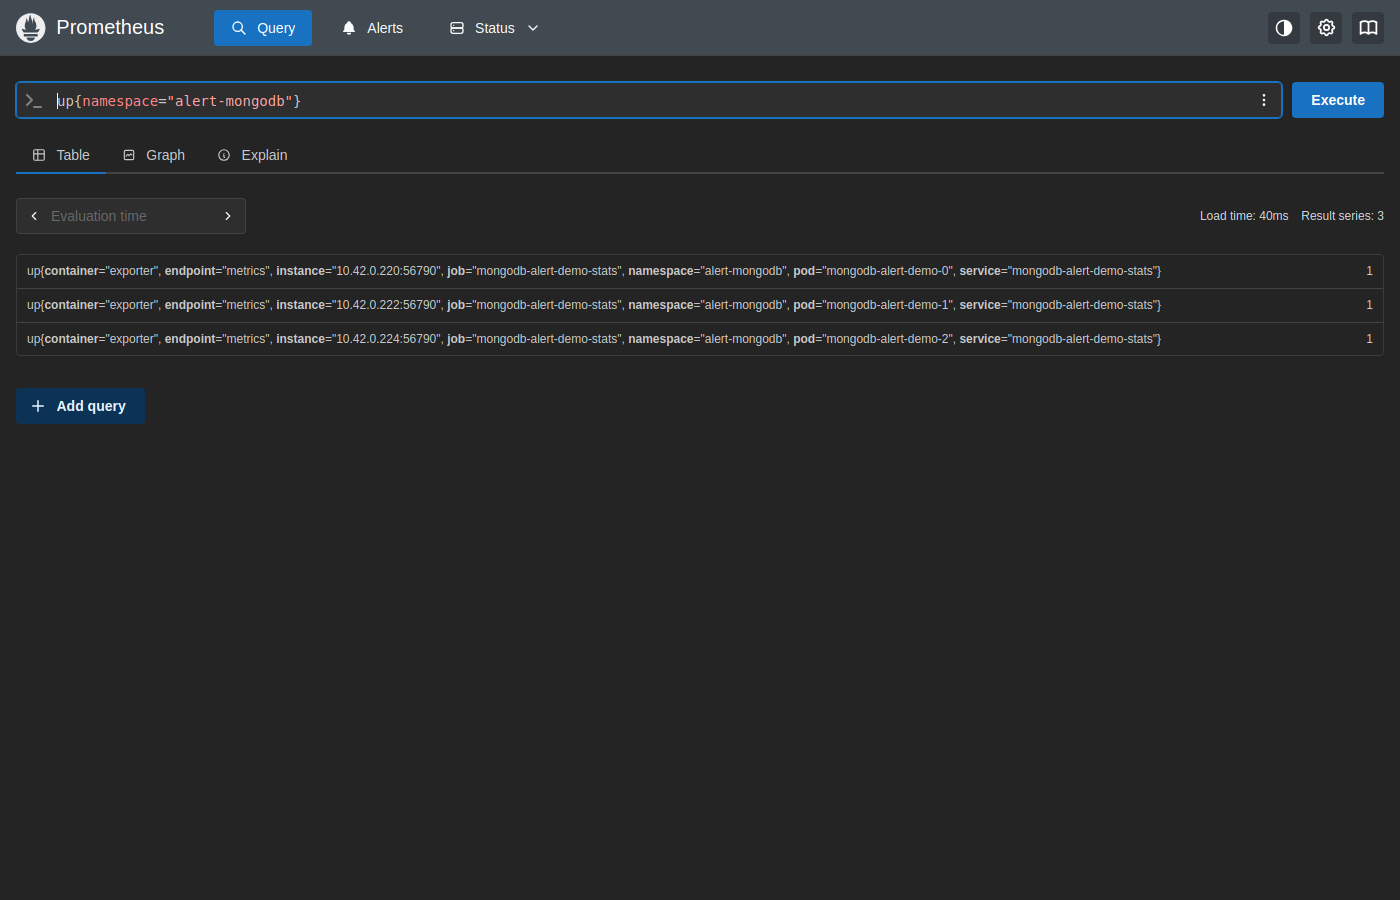
1. Check the Prometheus target is UP
Open http://localhost:9090/query?g0.expr=up%7Bnamespace%3D%22alert-mongodb%22%7D&g0.tab=1.
2. Confirm the MongoDB alerts are inactive
Open http://localhost:9090/alerts.
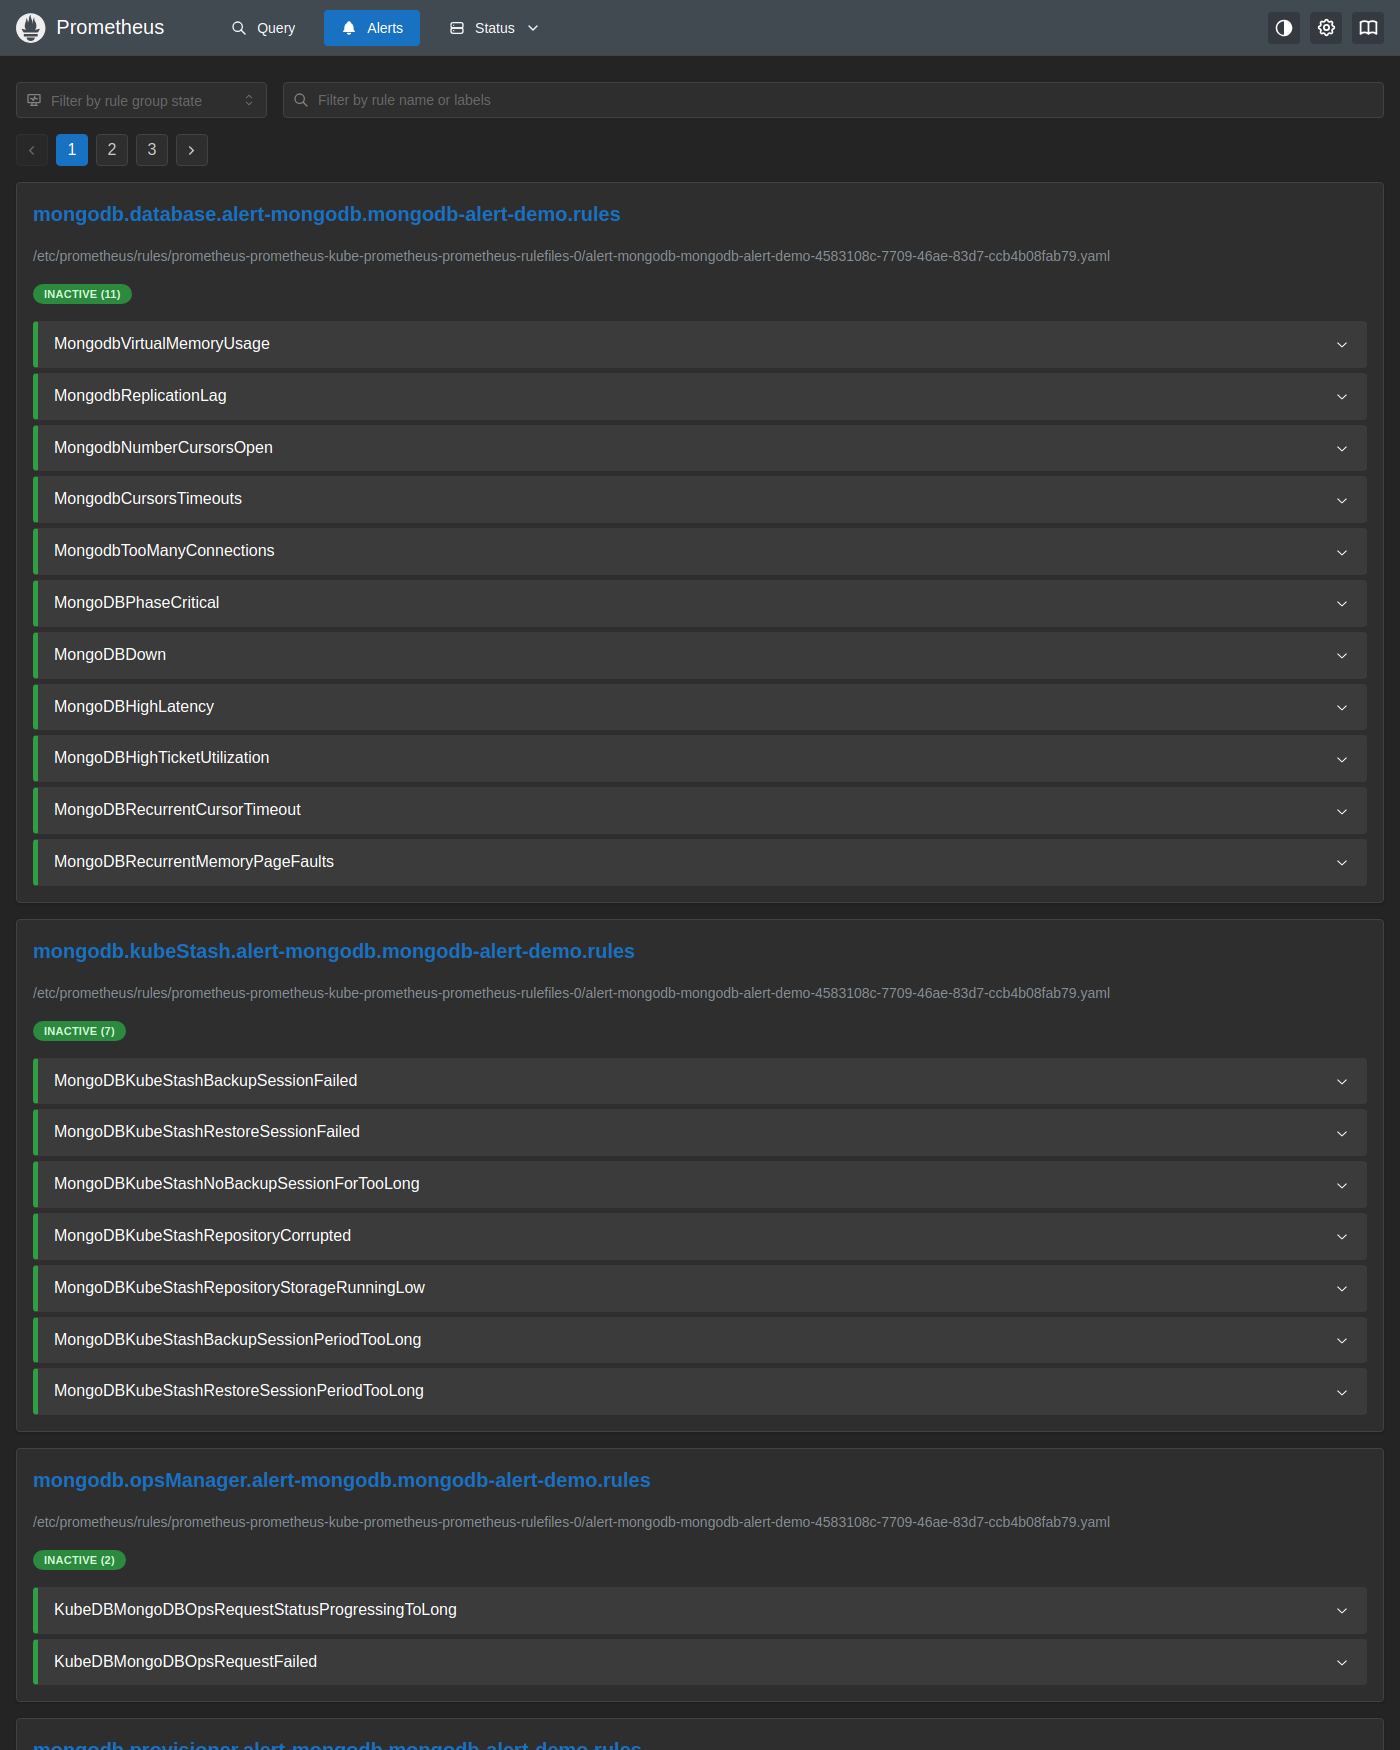
All rules should show INACTIVE, including MongoDBDown and MongoDBPhaseCritical — note these two are placed inside the database group even though, like the provisioner group’s alerts, they key off kubedb_com_mongodb_status_phase (the KubeDB operator’s own view), not a MongoDB-native metric. MongoDBDown fires much faster (for: 30s) than the provisioner group’s KubeDBMongoDBPhaseNotReady (for: 1m).
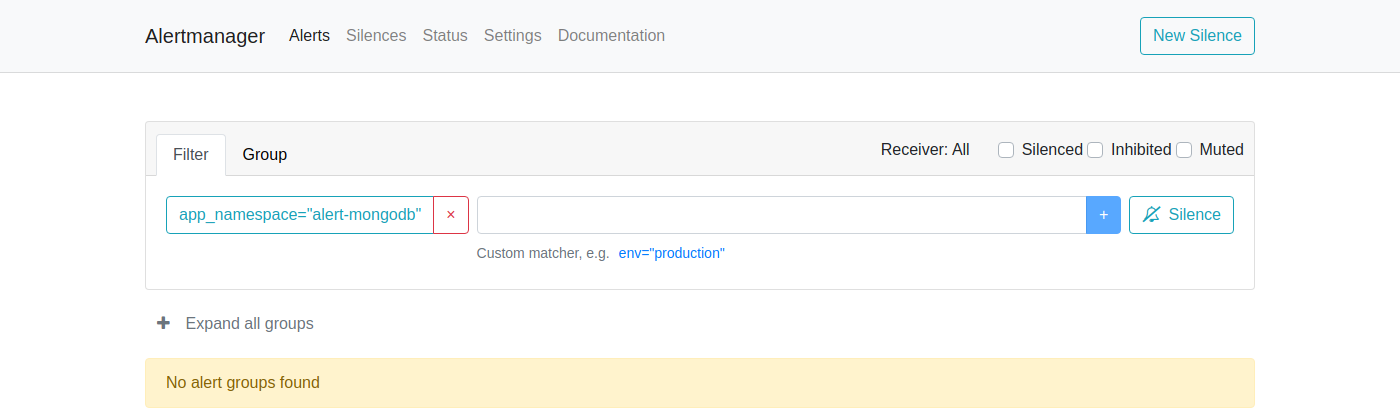
3. Check AlertManager
$ kubectl port-forward -n monitoring \
    svc/prometheus-kube-prometheus-alertmanager 9093:9093
Open http://localhost:9093.
Simulating a Firing Alert
This section deliberately triggers MongoDBDown (the fastest of the down-detection alerts, for: 30s) so you can observe the full alert lifecycle.
Note: MongoDB’s container runs
mongoddirectly asPID 1, with no supervisor wrapper in front of it — akill -9sent toPID 1from inside the same container has no effect, so it can’t be used to simulate a crash here.What actually works:
MongoDBDown(likeKubeDBMongoDBPhaseNotReady) is driven by the KubeDB operator’s own view of the resourcephase, not a per-pod metric — so disrupting just one pod of a 3-member replica set isn’t enough (the other two keep serving and the operator still reportsReady). Force-deleting all member pods in a repeating loop reliably denies the resource enough healthy members to stayReadyfor the duration of the loop.
1. Disrupt every MongoDB pod
$ end=$(( $(date +%s) + 90 ))
while [ $(date +%s) -lt $end ]; do
    kubectl delete pod -n alert-mongodb -l app.kubernetes.io/instance=mongodb-alert-demo --grace-period=0 --force >/dev/null 2>&1
    sleep 3
  done
Run this in the background (or a separate terminal) — repeatedly force-deleting all 3 pods keeps the replica set from having a stable Ready majority for the duration of the loop, which the KubeDB operator reports as the resource leaving Ready.
2. Watch the alert fire in Prometheus
Open http://localhost:9090/alerts.
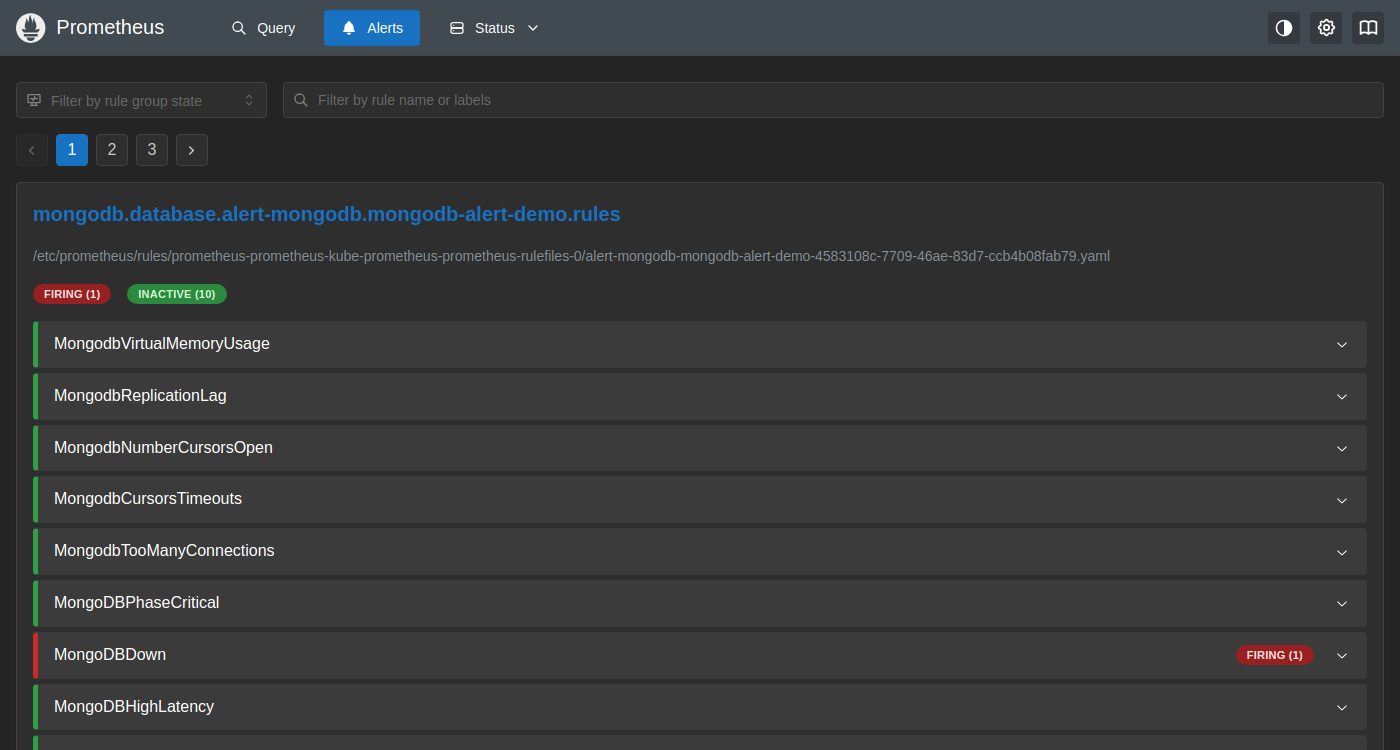
MongoDBDown (kubedb_com_mongodb_status_phase{phase!="Ready"} == 1, for: 30s) should transition to FIRING once the KubeDB operator observes the resource leaving Ready.
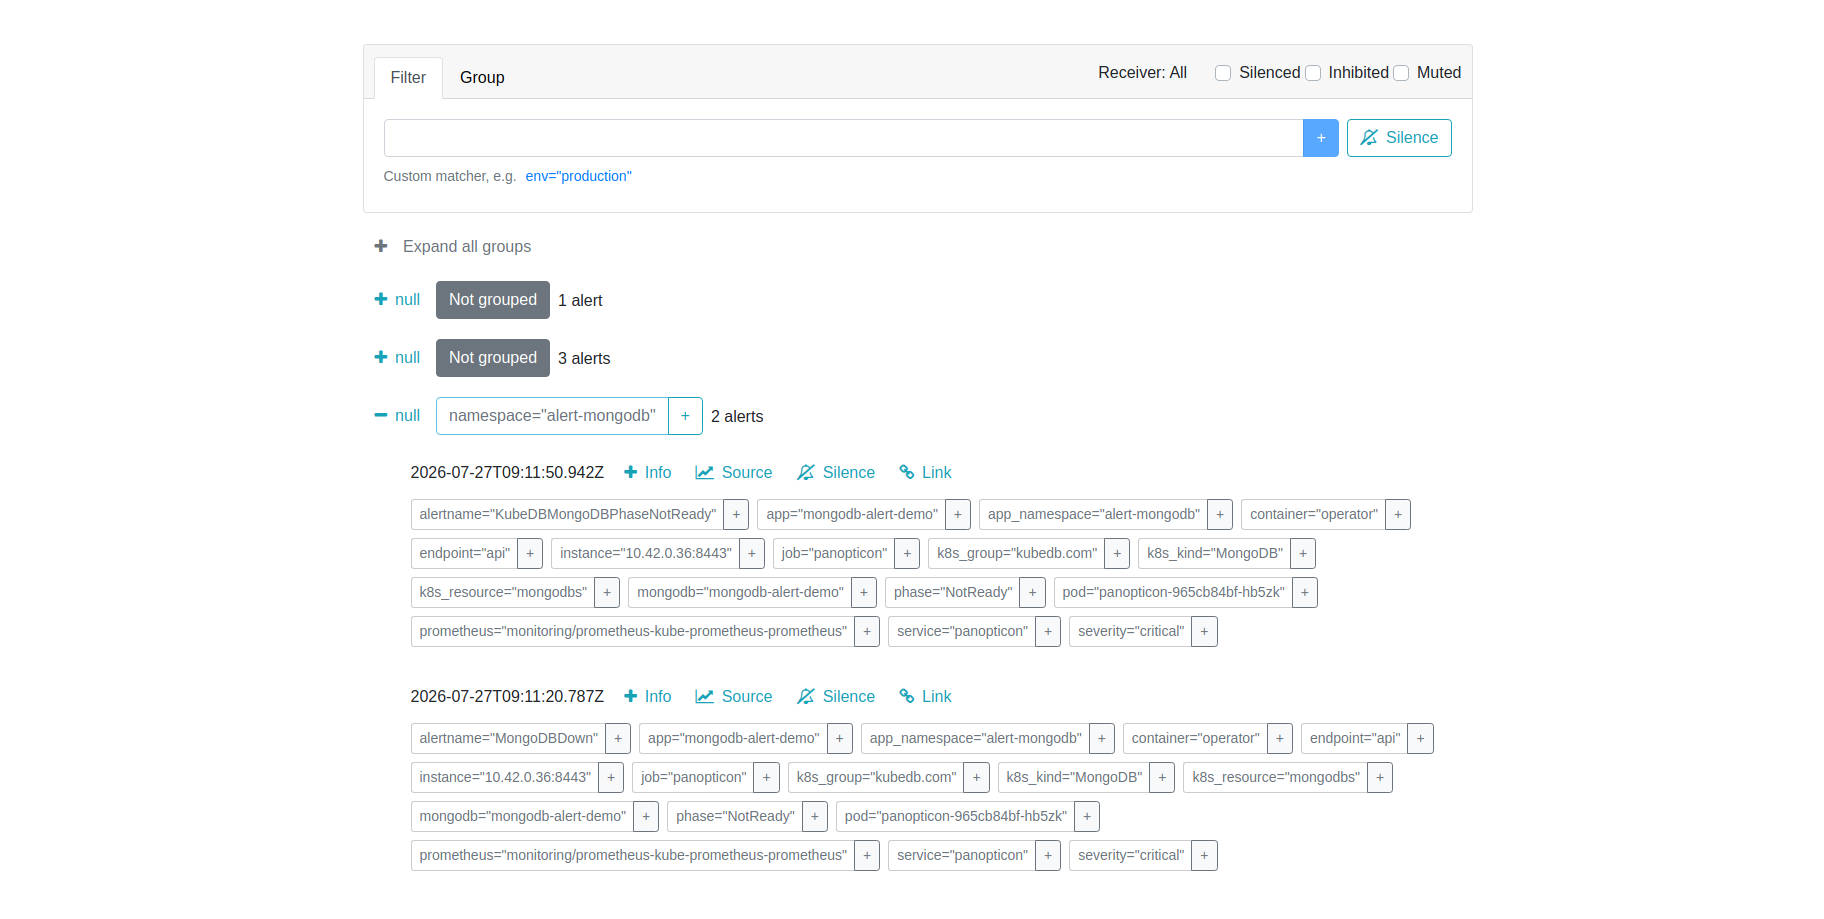
3. Check the AlertManager dashboard
Open http://localhost:9093.
4. Restore MongoDB
Let the loop from step 1 finish (or stop it early) — the StatefulSet recreates all 3 pods on its own once nothing is deleting them anymore.
$ kubectl get pods -n alert-mongodb
NAME                   READY   STATUS    RESTARTS   AGE
mongodb-alert-demo-0   3/3     Running   2          65s
mongodb-alert-demo-1   3/3     Running   0          37s
mongodb-alert-demo-2   3/3     Running   0          21s

$ kubectl get mongodb -n alert-mongodb mongodb-alert-demo -w
NAME                 VERSION   STATUS   AGE
mongodb-alert-demo   8.0.17    Ready    65m
Once all 3 pods are stably Running and the replica set has re-elected a primary, Prometheus marks MongoDBDown INACTIVE again and AlertManager sends a resolved notification. In testing this took well under a minute after the disruption loop ended.
Alert Reference
All alerts are scoped to the mongodb-alert-demo instance in the alert-mongodb namespace via the PromQL label filters job="mongodb-alert-demo-stats" / namespace="alert-mongodb" (most of the database group), or app="mongodb-alert-demo" / namespace="alert-mongodb" (provisioner/opsManager/stash/kubeStash/schemaManager groups, plus the two operator-phase alerts embedded in the database group).
Database Group
| Alert | Severity | For | What It Means |
|---|---|---|---|
MongodbVirtualMemoryUsage | warning | 1m | Virtual memory usage is high. |
MongodbReplicationLag | critical | instant | Replica set member is lagging behind the primary. |
MongodbNumberCursorsOpen | warning | 2m | Too many open cursors. |
MongodbCursorsTimeouts | warning | 2m | Cursor timeout rate is increasing. |
MongodbTooManyConnections | warning | 2m | Connection growth rate is high. |
MongoDBPhaseCritical | warning | 10m | KubeDB operator view: resource Critical (embedded here, duplicates provisioner group’s own version at a different for). |
MongoDBDown | critical | 30s | KubeDB operator view: resource not Ready. Fastest down-signal available for MongoDB. |
MongoDBHighLatency | warning | 10m | Operation latency is elevated. |
MongoDBHighTicketUtilization | warning | 10m | WiredTiger concurrency tickets are close to exhausted. |
MongoDBRecurrentCursorTimeout | warning | 30m | Cursor timeouts recurring over a longer window. |
MongoDBRecurrentMemoryPageFaults | warning | 30m | Page faults recurring over a longer window. |
DiskUsageHigh | warning | 1m | Disabled by the install command above. |
DiskAlmostFull | critical | 1m | Disabled by the install command above. |
Provisioner Group
| Alert | Severity | For | What It Means |
|---|---|---|---|
KubeDBMongoDBPhaseNotReady | critical | 1m | KubeDB marked the MongoDB resource NotReady. |
KubeDBMongoDBPhaseCritical | warning | 15m | MongoDB is degraded but not fully unavailable. |
OpsManager Group
| Alert | Severity | For | What It Means |
|---|---|---|---|
KubeDBMongoDBOpsRequestStatusProgressingToLong | critical | 30m | An ops request has been running for 30+ minutes. |
KubeDBMongoDBOpsRequestFailed | critical | instant | An ops request failed. |
Stash / KubeStash Groups
| Alert | Severity | For | What It Means |
|---|---|---|---|
MongoDBStashBackupSessionFailed / MongoDBKubeStashBackupSessionFailed | critical | instant | Most recent backup session failed. |
MongoDBStashRestoreSessionFailed / MongoDBKubeStashRestoreSessionFailed | critical | instant | Most recent restore session failed. |
MongoDBStashNoBackupSessionForTooLong / MongoDBKubeStashNoBackupSessionForTooLong | warning | instant | No recent successful backup. |
MongoDBStashRepositoryCorrupted / MongoDBKubeStashRepositoryCorrupted | critical | 5m | Backup repository integrity check failed. |
MongoDBStashRepositoryStorageRunningLow / MongoDBKubeStashRepositoryStorageRunningLow | warning | 5m | Backup repository storage usage is high. |
MongoDBStashBackupSessionPeriodTooLong / MongoDBKubeStashBackupSessionPeriodTooLong | warning | instant | Backup session taking unusually long. |
MongoDBStashRestoreSessionPeriodTooLong / MongoDBKubeStashRestoreSessionPeriodTooLong | warning | instant | Restore session taking unusually long. |
SchemaManager Group
| Alert | Severity | For | What It Means |
|---|---|---|---|
KubeDBMongoDBSchemaPendingForTooLong | warning | 30m | A MongoDBDatabase object stuck Pending. |
KubeDBMongoDBSchemaInProgressForTooLong | warning | 30m | A MongoDBDatabase object stuck InProgress. |
KubeDBMongoDBSchemaTerminatingForTooLong | warning | 30m | A MongoDBDatabase object stuck Terminating. |
KubeDBMongoDBSchemaFailed | warning | instant | A MongoDBDatabase object failed. |
KubeDBMongoDBSchemaExpired | warning | instant | A MongoDBDatabase object expired. |
Customising Alerts
# custom-alerts.yaml
form:
  alert:
    labels:
      release: prometheus
    groups:
      database:
        enabled: warning
        rules:
          mongodbTooManyConnections:
            enabled: true
            duration: "5m"
            severity: warning
$ helm upgrade mongodb-alert-demo oci://ghcr.io/appscode-charts/mongodb-alerts \
    -n alert-mongodb \
    --version=v2026.7.14 \
    -f custom-alerts.yaml
Cleaning up
To remove all resources created in this tutorial, run the following commands.
# Remove the mongodb-alerts release (PrometheusRule + dashboard-import Job)
$ helm uninstall mongodb-alert-demo -n alert-mongodb

# Remove the imported Grafana dashboard (it is not removed by helm uninstall)
$ curl -s -X DELETE -H "Authorization: Bearer <grafana-token>" \
    http://localhost:3000/api/dashboards/uid/<uid>

$ kubectl delete mongodb -n alert-mongodb mongodb-alert-demo
$ kubectl delete ns alert-mongodb

# Uninstall monitoring stack (optional — skip if other tutorials on this cluster still need them)
$ helm uninstall panopticon -n kubeops
$ helm uninstall prometheus -n monitoring
Next Steps
- Monitor your MongoDB database with KubeDB using built-in Prometheus.
- Monitor your MongoDB database with KubeDB using Prometheus operator.
- Want to hack on KubeDB? Check our contribution guidelines.