









































New to KubeDB? Please start here.
ClickHouse Alerting with Prometheus
This tutorial shows you how to configure Prometheus-based alerting for a KubeDB-managed ClickHouse instance using the clickhouse-alerts Helm chart.
Before You Begin
Ensure you have a Kubernetes cluster and that
kubectlis configured to communicate with it. If you do not already have a cluster, you can create one using kind.Install the KubeDB operator by following the steps here.
Deploy the database in the
alert-clickhousenamespace:$ kubectl create ns alert-clickhouse namespace/alert-clickhouse createdTo learn more about how Prometheus monitoring works with KubeDB, see the overview here.
Note: YAML files used in this tutorial are stored in docs/examples/clickhouse folder in GitHub repository kubedb/docs.
Configuration
Step 1 (
kube-prometheus-stack) is required to follow this tutorial. Step 2 (Panopticon) is required for the Provisioner Group alerts below (KubeDBClickHousePhase...) — skip it only if you just want the exporter-based Database Group alerts. If you have already completed the step(s) you need in another guide, skip ahead.
Step 1: Deploy kube-prometheus-stack
kube-prometheus-stack installs Prometheus, Prometheus Operator, Alertmanager, and Grafana together. This is the recommended way to get the full monitoring stack on Kubernetes.
Add the prometheus-community Helm repo and install:
$ helm repo add prometheus-community https://prometheus-community.github.io/helm-charts
$ helm repo update

$ helm upgrade --install prometheus prometheus-community/kube-prometheus-stack \
  --namespace monitoring --create-namespace \
  --set grafana.image.tag=7.5.5
Wait for all pods to be ready:
$ kubectl get pods -n monitoring
NAME                                                   READY   STATUS    RESTARTS   AGE
alertmanager-prometheus-kube-prometheus-alertmanager-0 2/2     Running   0          2m
prometheus-grafana-xxxx                                3/3     Running   0          2m
prometheus-kube-prometheus-operator-xxxx               1/1     Running   0          2m
prometheus-kube-prometheus-prometheus-0                2/2     Running   0          2m
prometheus-kube-state-metrics-xxxx                     1/1     Running   0          2m
Find the serviceMonitorSelector/ruleSelector labels that Prometheus uses to pick up ServiceMonitor/PrometheusRule objects — this is the release: prometheus label used throughout this tutorial.
$ kubectl get prometheus -n monitoring -o jsonpath='{.items[0].spec.ruleSelector}'
{"matchLabels":{"release":"prometheus"}}

$ kubectl get prometheus -n monitoring -o jsonpath='{.items[0].spec.serviceMonitorSelector}'
{"matchLabels":{"release":"prometheus"}}
Step 2: Install Panopticon (required for the Provisioner Group alerts)
Panopticon is the Appscode operator that exports the KubeDB operator’s own view of every resource — kubedb_com_clickhouse_status_phase and related metrics. It’s what powers the Provisioner Group alerts below (KubeDBClickHousePhaseNotReady/KubeDBClickHousePhaseCritical). Skip this step if you only need the exporter-based Database Group alerts.
$ helm repo add appscode https://charts.appscode.com/stable/
$ helm repo update

$ helm upgrade --install panopticon appscode/panopticon \
  --version v2026.4.30 \
  --namespace kubeops --create-namespace \
  --set monitoring.enabled=true \
  --set monitoring.agent=prometheus.io/operator \
  --set monitoring.serviceMonitor.labels.release=prometheus \
  --set-file license=/path/to/kubedb-license.txt \
  --wait --timeout 5m0s
Verify Panopticon is running:
$ kubectl get pods -n kubeops
NAME                          READY   STATUS    RESTARTS   AGE
panopticon-xxxx               1/1     Running   0          1m
Overview

- KubeDB deploys ClickHouse with metrics exposed by a JMX Exporter-style Java agent running inside the
clickhousecontainer itself on port9363— there is no separate exporter sidecar container, and only one container runs in the pod. - ServiceMonitor (named
{clickhouse-name}-stats) is created automatically by KubeDB and tells Prometheus to scrape the metrics endpoint every 10 seconds. - PrometheusRule is created by the
clickhouse-alertschart and contains ClickHouse alert definitions grouped by concern: database health, provisioner, ops-manager, and KubeStash backup/restore. - Prometheus Operator evaluates every rule expression every 30 seconds and fires matching alerts to AlertManager.
- AlertManager groups, inhibits, and silences alerts, then routes them to configured receivers (Slack, email, PagerDuty, webhook, etc.).
Deploy ClickHouse with Monitoring Enabled
Below is the ClickHouse object we are going to create — a single-node instance with monitoring enabled.
apiVersion: kubedb.com/v1alpha2
kind: ClickHouse
metadata:
  name: clickhouse-alert-demo
  namespace: alert-clickhouse
spec:
  version: "26.2.6"
  replicas: 1
  storage:
    storageClassName: "local-path"
    accessModes:
      - ReadWriteOnce
    resources:
      requests:
        storage: 1Gi
  deletionPolicy: WipeOut
  monitor:
    agent: prometheus.io/operator
    prometheus:
      serviceMonitor:
        labels:
          release: prometheus
        interval: 10s
Here,
spec.monitor.agent: prometheus.io/operatortells KubeDB to create aServiceMonitorresource managed by the Prometheus operator.spec.monitor.prometheus.serviceMonitor.labels.release: prometheusmatches the PrometheusserviceMonitorSelectorso the target is discovered automatically.
$ kubectl apply -f https://github.com/kubedb/docs/raw/v2026.7.10/docs/examples/clickhouse/monitoring/clickhouse-alert-demo.yaml
clickhouse.kubedb.com/clickhouse-alert-demo created
Wait for the database to go into Ready state.
$ kubectl get clickhouse -n alert-clickhouse clickhouse-alert-demo
NAME                    VERSION   STATUS   AGE
clickhouse-alert-demo   24.4.1    Ready    3m
KubeDB creates a dedicated stats service with the -stats suffix for monitoring.
$ kubectl get svc -n alert-clickhouse --selector="app.kubernetes.io/instance=clickhouse-alert-demo"
NAME                          TYPE        CLUSTER-IP      EXTERNAL-IP   PORT(S)              AGE
clickhouse-alert-demo         ClusterIP   10.43.102.159   <none>        9000/TCP,8123/TCP    3m
clickhouse-alert-demo-pods    ClusterIP   None            <none>        9000/TCP,8123/TCP    3m
clickhouse-alert-demo-stats   ClusterIP   10.43.76.0      <none>        9363/TCP             3m
KubeDB also creates a ServiceMonitor that tells Prometheus where to scrape.
$ kubectl get servicemonitor -n alert-clickhouse
NAME                          AGE
clickhouse-alert-demo-stats   3m
Verify that the ServiceMonitor carries the release: prometheus label so Prometheus discovers it.
$ kubectl get servicemonitor -n alert-clickhouse clickhouse-alert-demo-stats \
    -o jsonpath='{.metadata.labels.release}'
prometheus
Step 1 — Install clickhouse-alerts
The clickhouse-alerts chart creates a PrometheusRule resource containing all ClickHouse alert definitions.
Why the Helm release name matters
The chart derives the PrometheusRule name and scopes every PromQL expression (via job="{release-name}-stats" / app="{release-name}") from the Helm release name — so the release name must match the ClickHouse object’s name (clickhouse-alert-demo) for the rules to be correctly scoped to this instance.
The chart’s default label is release: kube-prometheus-stack, so we must also override it at install time tkubectl patch petset -n alert-solr solr-alert
–type=merge
-p ‘{“spec”:{“replicas”:0}}‘o match the Prometheus ruleSelector.
Install
$ helm upgrade -i clickhouse-alert-demo appscode/clickhouse-alerts \
    -n alert-clickhouse \
    --create-namespace \
    --version=v2026.7.14 \
    --set form.alert.appSuffix=ch-grafana-demo
| Flag | Value | Purpose |
|---|---|---|
clickhouse-alert-demo (release name) | — | Scopes every PromQL expression to this instance (job="clickhouse-alert-demo-stats", app="clickhouse-alert-demo") |
-n alert-clickhouse | alert-clickhouse | Installs the PrometheusRule in the same namespace as the database |
form.alert.labels.release | prometheus | Matches the Prometheus ruleSelector so the rules are loaded |
Don’t bother with
--set grafana.enabled=true— as explained at the top of this tutorial, this chart version doesn’t actually render anything for it.
Verify the PrometheusRule is created
$ kubectl get prometheusrule -n alert-clickhouse
NAME                    AGE
clickhouse-alert-demo   30s
Confirm the release: prometheus label is present.
$ kubectl get prometheusrule -n alert-clickhouse clickhouse-alert-demo \
    -o jsonpath='{.metadata.labels.release}'
prometheus
Confirm Prometheus loaded the rules
Port-forward the Prometheus UI.
$ kubectl port-forward -n monitoring \
    svc/prometheus-kube-prometheus-prometheus 9090:9090
Open http://localhost:9090/rules?search=clickhouse.
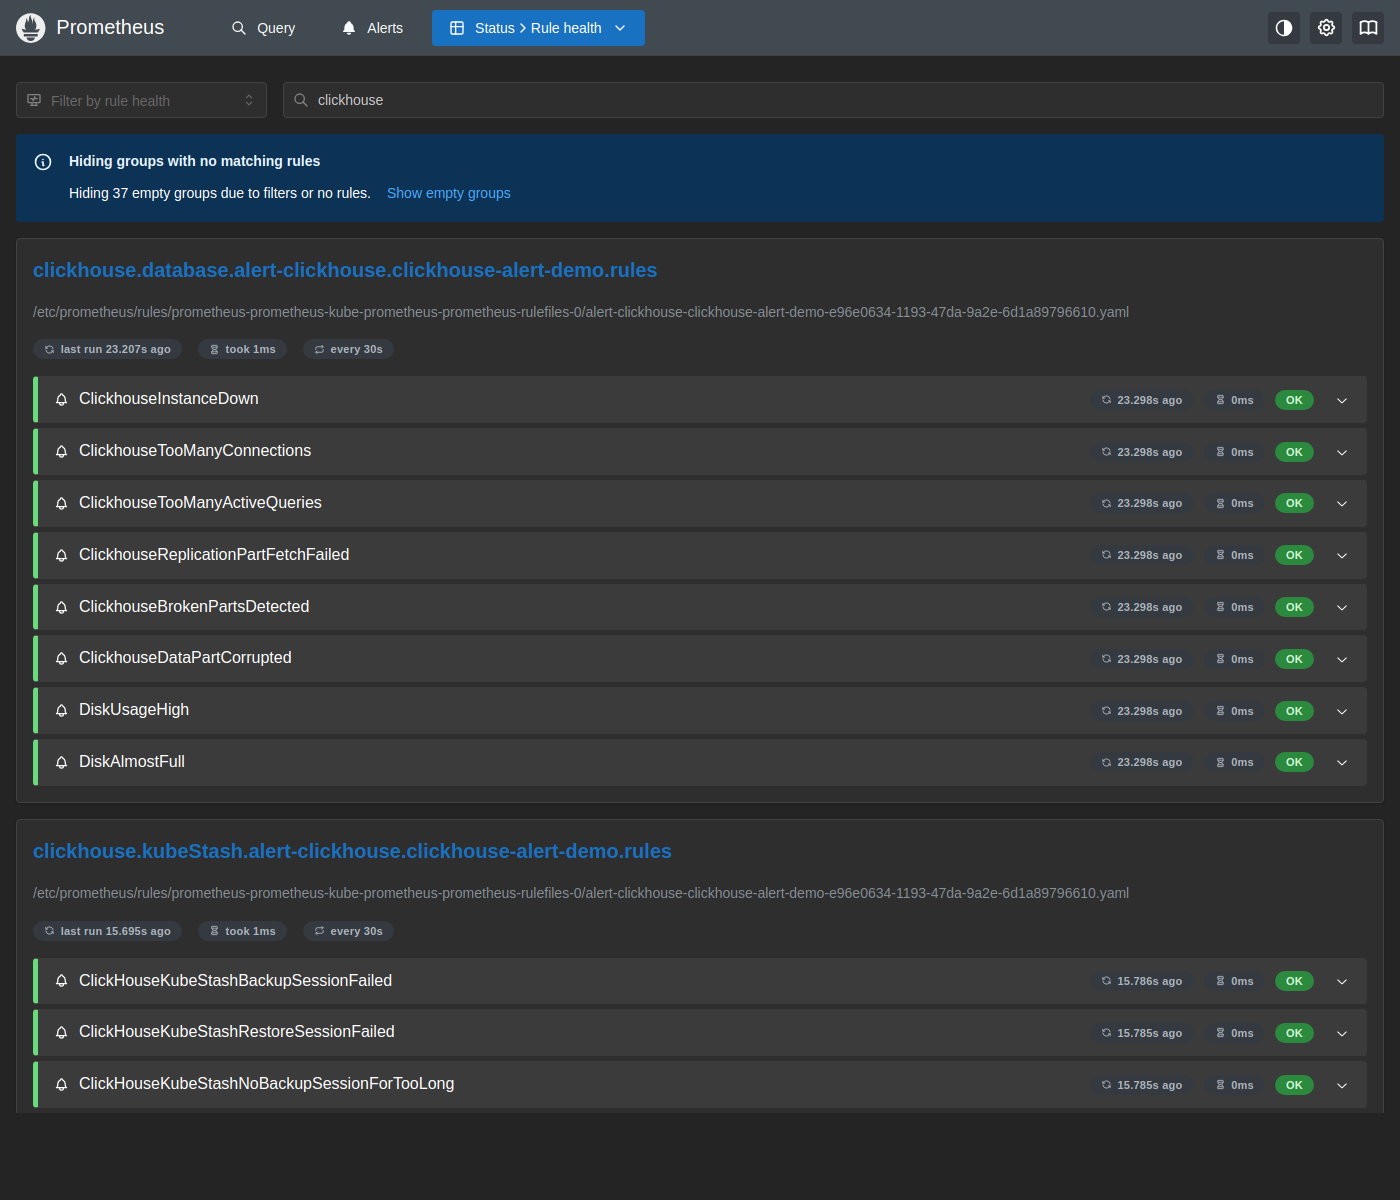
All four groups — clickhouse.database, clickhouse.provisioner, clickhouse.opsManager, and clickhouse.kubeStash — are visible with all rules showing OK, confirming that Prometheus has loaded and is evaluating the ClickHouse alert definitions every 30 seconds. The database group’s DiskUsageHigh/DiskAlmostFull rules correctly divide by kubelet_volume_stats_capacity_bytes in this chart, reflecting real PVC usage.
Verify End-to-End
1. Check the Prometheus target is UP
Open http://localhost:9090/query?g0.expr=up%7Bnamespace%3D%22alert-clickhouse%22%7D&g0.tab=1.
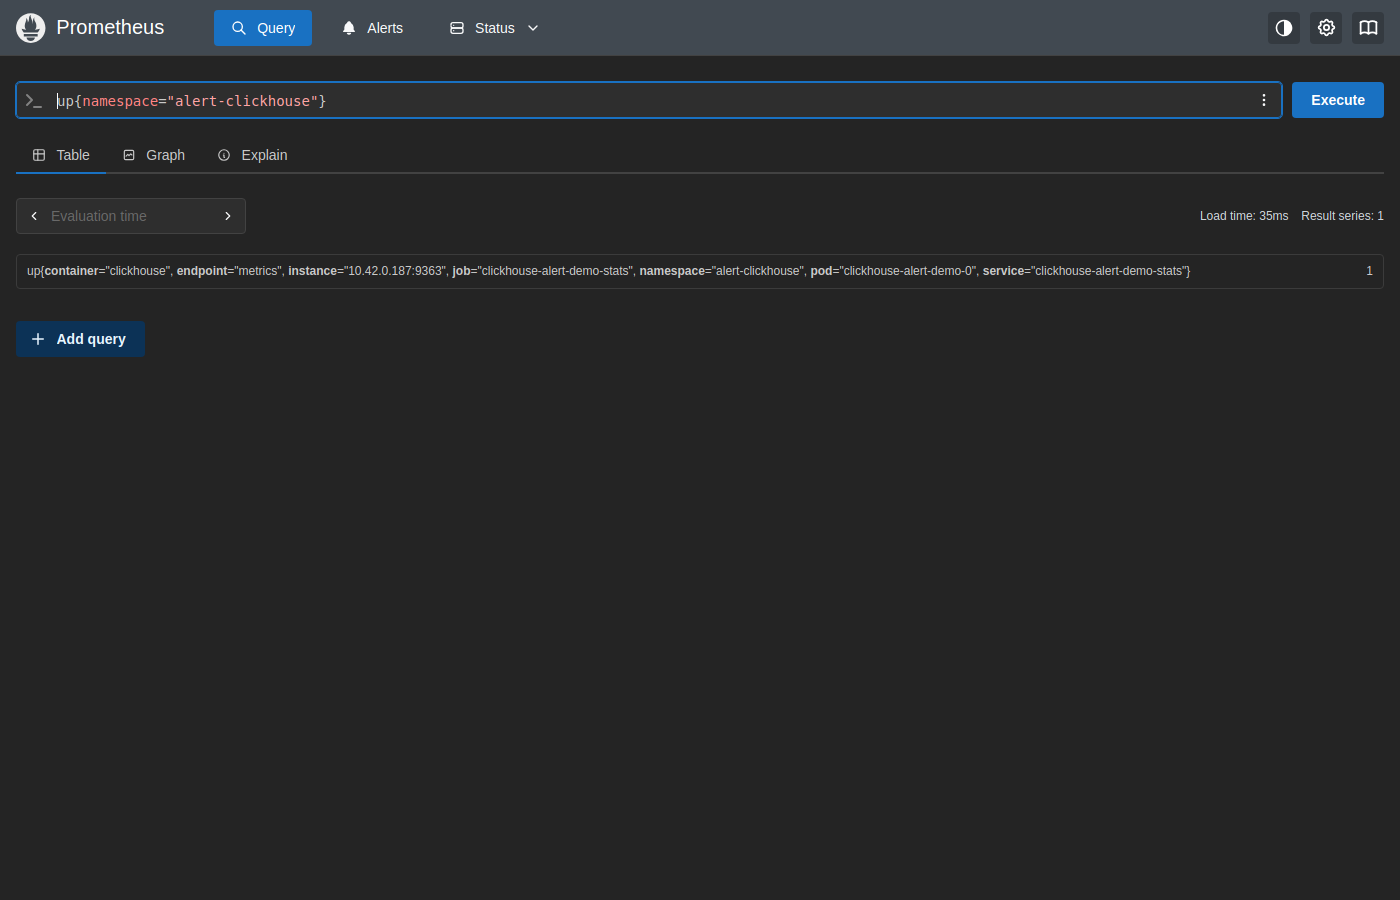
The clickhouse-alert-demo-0 pod reports up == 1 via the clickhouse-alert-demo-stats service/job on port 9363, confirming Prometheus is scraping the JMX agent successfully.
2. Confirm the ClickHouse alerts are inactive
Open http://localhost:9090/alerts?search=clickhouse.
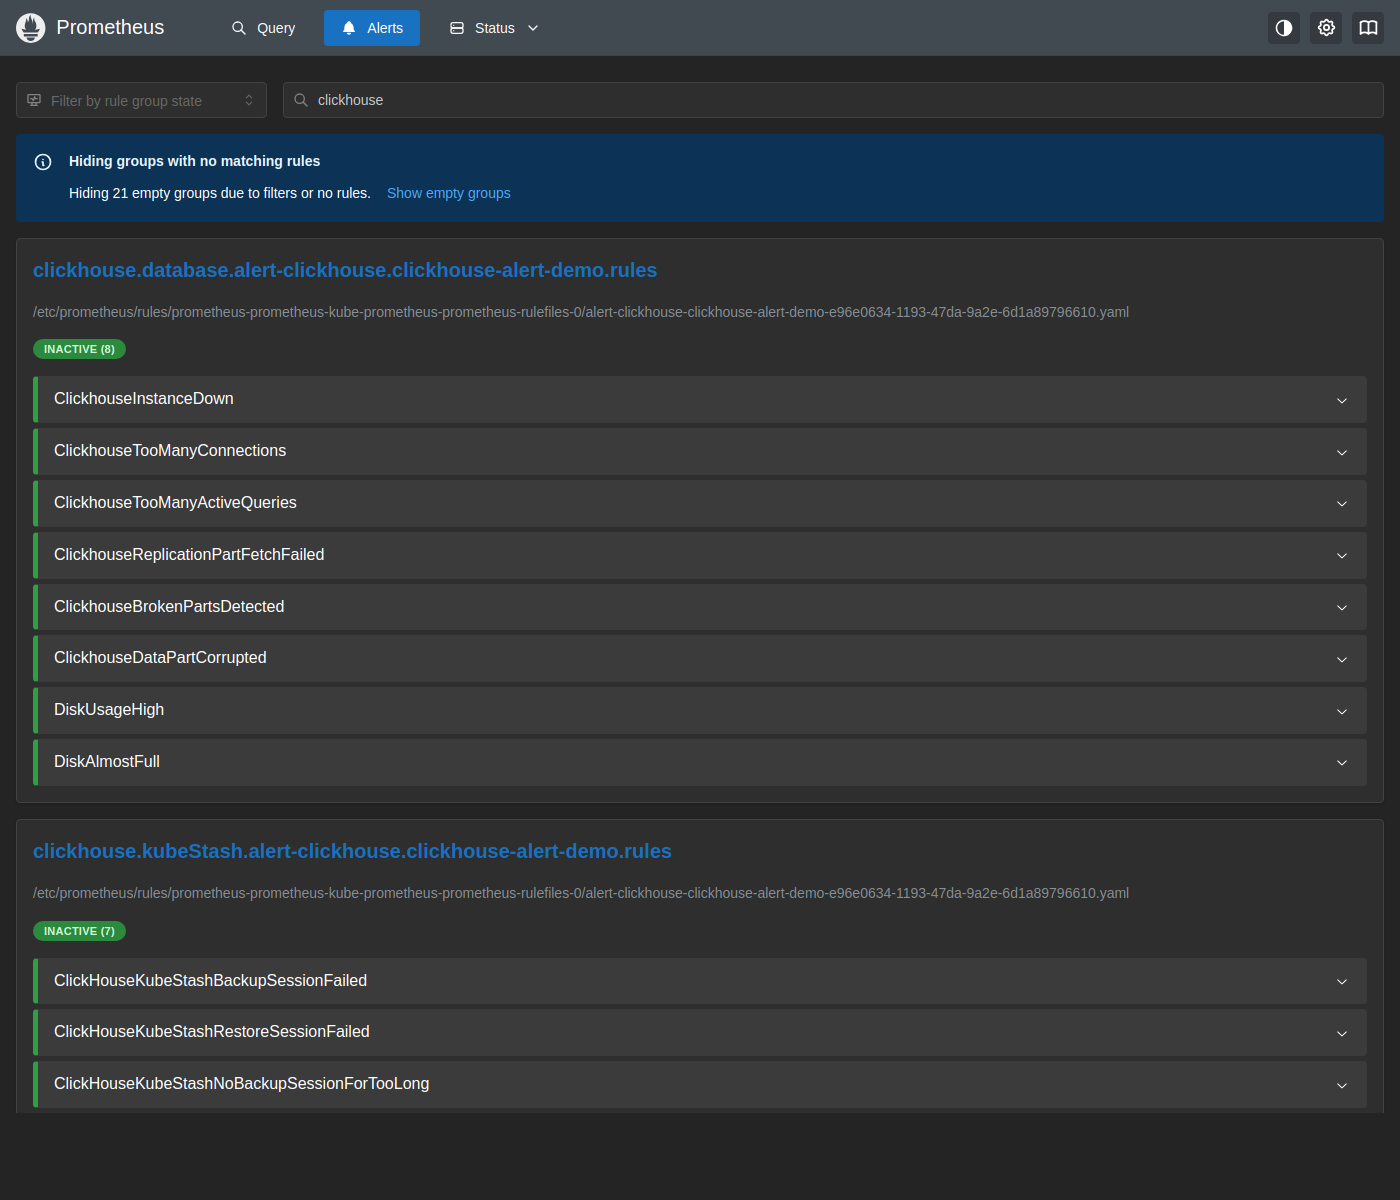
All rules across the clickhouse.database, clickhouse.provisioner, clickhouse.opsManager, and clickhouse.kubeStash groups show INACTIVE, confirming the instance is healthy and no thresholds are breached. (clickhouse.kubeStash rules stay INACTIVE with no data unless KubeStash backups are configured on this instance.)
3. Check AlertManager
Port-forward AlertManager to view any currently firing alerts.
$ kubectl port-forward -n monitoring \
    svc/prometheus-kube-prometheus-alertmanager 9093:9093
Open http://localhost:9093.
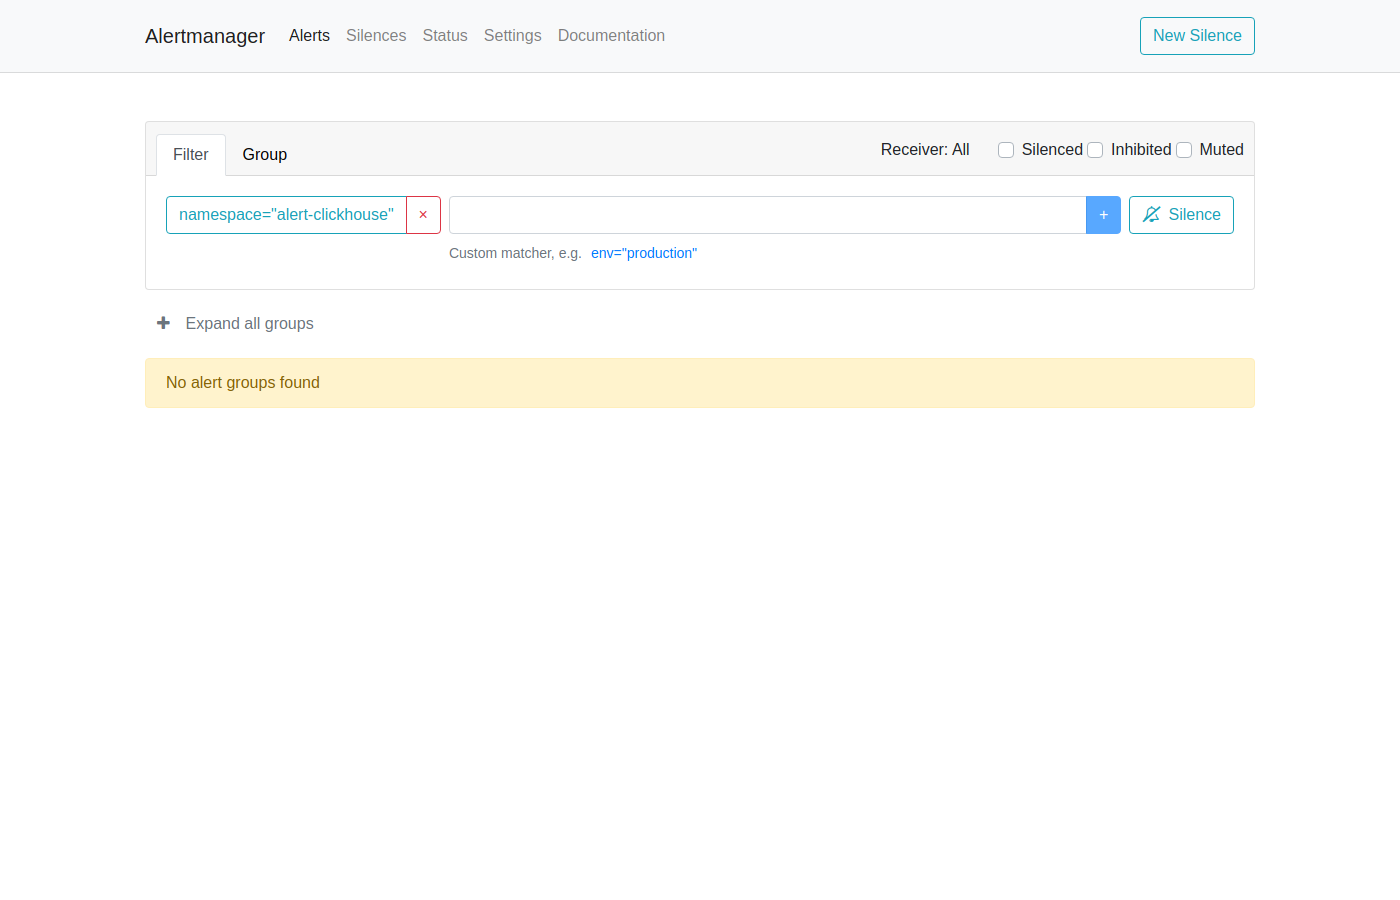
No alerts are firing for the alert-clickhouse namespace.
Simulating a Firing Alert
This section deliberately triggers ClickhouseInstanceDown so you can observe the full alert lifecycle — from firing in Prometheus through to the AlertManager dashboard — and then resolve it.
The clickhouse container’s PID 1 is the clickhouse-server process itself, unlike most other KubeDB images in this project where PID 1 is a supervisor (tini, a wrapper script) around the real database process. This matters: kubectl exec ... kill -9 1 does nothing here. A container’s PID 1 is also PID 1 of that container’s own PID namespace, and Linux unconditionally ignores SIGKILL/SIGSTOP sent to a namespace’s PID 1 from within that same namespace (kubectl exec attaches to the same namespace) — confirmed by checking readlink /proc/1/ns/pid and /proc/self/ns/pid inside the container (identical), then observing kill -9 1 return exit code 0 while /proc/1’s elapsed-time counter kept climbing, completely unaffected. This is a kernel-level protection — only a signal delivered from outside the namespace (e.g. the container runtime stopping the container) can kill a namespace’s PID 1 this way.
What works instead: ask ClickHouse to shut itself down via SQL — SYSTEM SHUTDOWN — which exits the process voluntarily rather than relying on an external signal, and Kubernetes restarts the container normally afterward. A single shutdown recovers in only a few seconds (too fast to reliably observe), so loop it from outside the container: each SYSTEM SHUTDOWN call takes down the very kubectl exec session that issued it (its container just exited), so the retry has to be a fresh kubectl exec per iteration, not a loop running inside one exec session.
1. Crash the ClickHouse process repeatedly
$ end=$(( $(date +%s) + 150 ))
while [ $(date +%s) -lt $end ]; do
  kubectl exec -n alert-clickhouse clickhouse-alert-demo-0 -c clickhouse -- kill 1
  sleep 1
done
Retrieve the password first if you don’t have it: kubectl get secret -n alert-clickhouse clickhouse-alert-demo-auth -o jsonpath='{.data.password}' | base64 -d. Run the loop in the background (or a separate terminal) — each iteration either succeeds (shutting the instance down again) or fails harmlessly while a previous shutdown is still restarting, so 90 seconds comfortably holds the instance in a crash loop.
2. Watch the alert fire in Prometheus
Open http://localhost:9090/alerts?search=clickhouse.
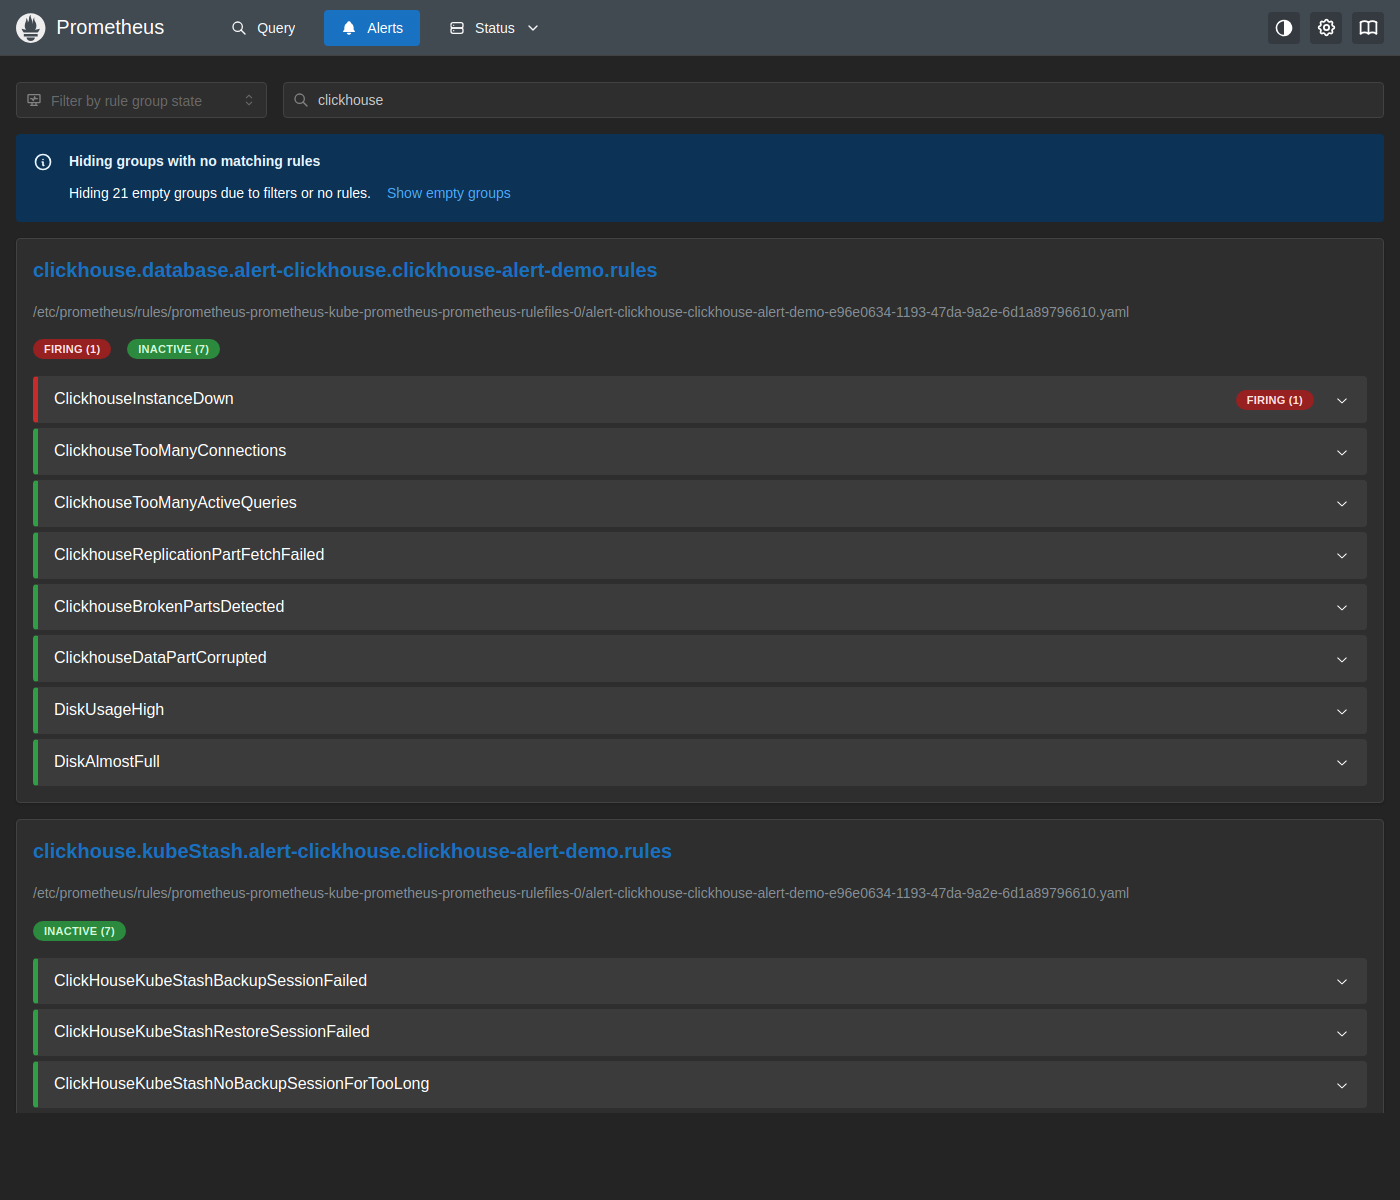
ClickhouseInstanceDown (up{job="clickhouse-alert-demo-stats"} == 0, for: 1m) transitions from INACTIVE to FIRING once the crash loop has kept the scrape target down continuously for the full window, while the rest of the clickhouse.database group stays INACTIVE.
3. Check the AlertManager dashboard
Open http://localhost:9093/#/alerts?filter={namespace="alert-clickhouse"}.
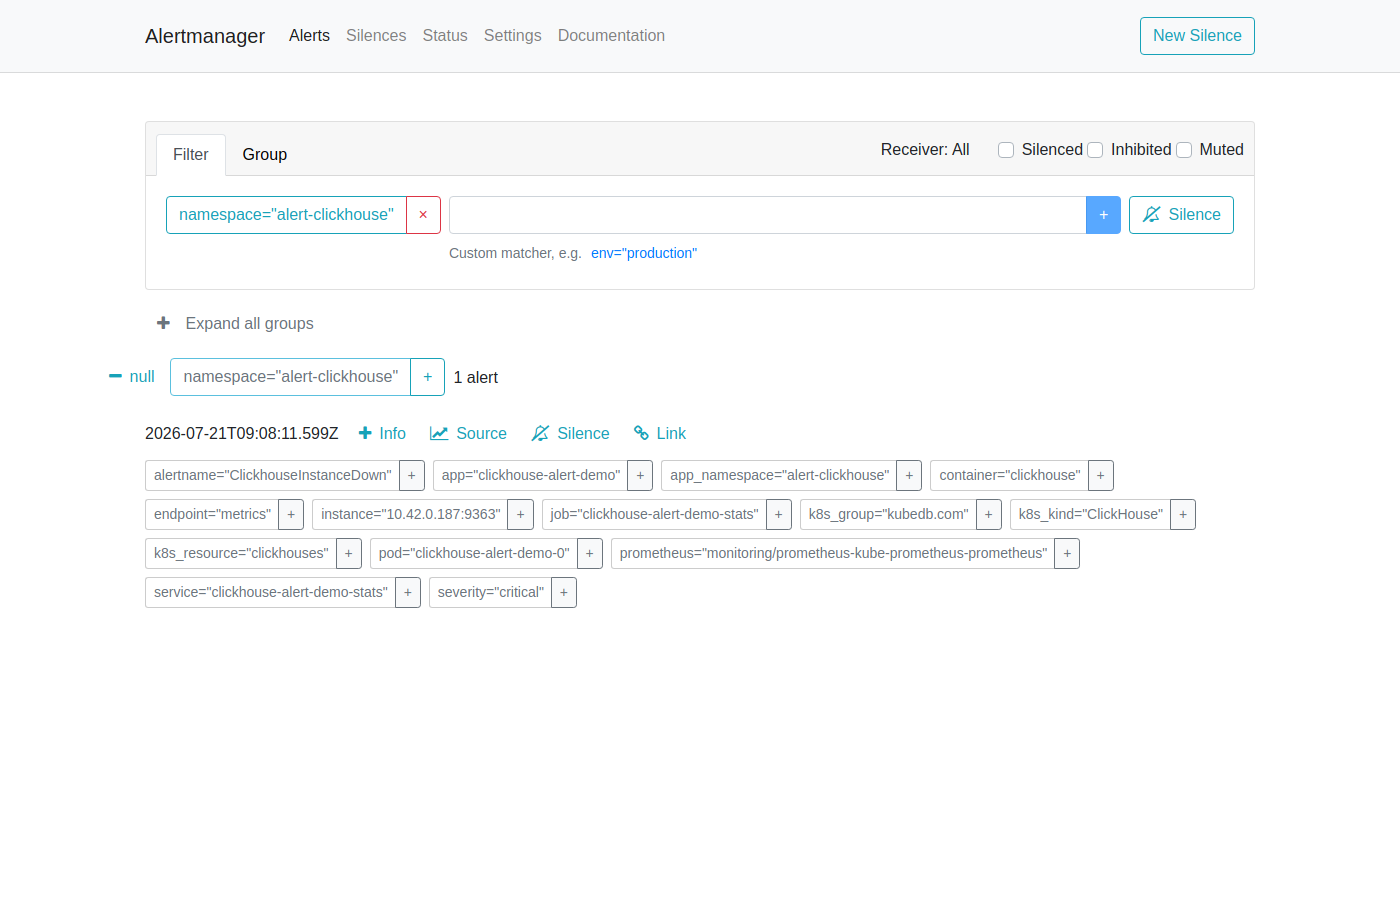
AlertManager shows the ClickhouseInstanceDown alert. The alert card displays:
- Severity:
critical - pod:
clickhouse-alert-demo-0 - job:
clickhouse-alert-demo-stats - namespace / app_namespace:
alert-clickhouse - Started: timestamp when the alert first fired
AlertManager routes this alert to every receiver configured in your alertmanagerConfig (Slack, email, PagerDuty, webhook, etc.) based on your routing tree. If no receiver is configured, the alert is visible here but silently dropped.
4. Restore ClickHouse
Let the loop from step 1 finish (or stop it early) — the pod recovers on its own once no further shutdowns land.
$ kubectl get pods -n alert-clickhouse
NAME                      READY   STATUS    RESTARTS   AGE
clickhouse-alert-demo-0   1/1     Running   5          18m
Once the pod is stably 1/1 Running and the next scrape reports up == 1, Prometheus marks the alert INACTIVE again (took about a minute after the loop ended in testing, since the for: 1m window has to elapse clean) and AlertManager sends a resolved notification to all receivers. If the pod doesn’t stabilize on its own, force a clean restart: kubectl delete pod -n alert-clickhouse clickhouse-alert-demo-0.
Alert Reference
All alerts are scoped to the clickhouse-alert-demo instance in the alert-clickhouse namespace via the PromQL label filters job="clickhouse-alert-demo-stats" / namespace="alert-clickhouse" (database group), or app="clickhouse-alert-demo" / namespace="alert-clickhouse" (provisioner/opsManager/kubeStash groups).
Database Group
| Alert | Severity | For | What It Means |
|---|---|---|---|
ClickhouseInstanceDown | critical | 1m | The JMX agent’s scrape target reports up == 0. |
ClickhouseTooManyConnections | critical | 5m | Too many concurrent TCP connections. |
ClickhouseTooManyActiveQueries | warning | 1m | Too many queries running concurrently. |
ClickhouseReplicationPartFetchFailed | warning | 5m | Replicated part fetches are failing. |
ClickhouseBrokenPartsDetected | critical | instant | Too many unexpected data parts detected. |
ClickhouseDataPartCorrupted | warning | 5m | A data part failed a parse/assertion check. |
DiskUsageHigh | warning | 5m | Persistent volume usage exceeds the configured threshold. |
DiskAlmostFull | critical | 5m | Persistent volume usage is critically high. |
Provisioner Group
| Alert | Severity | For | What It Means |
|---|---|---|---|
KubeDBClickHousePhaseNotReady | critical | 1m | KubeDB marked the ClickHouse resource NotReady. |
KubeDBClickHousePhaseCritical | warning | 15m | ClickHouse is degraded but not fully unavailable. |
OpsManager Group
| Alert | Severity | For | What It Means |
|---|---|---|---|
KubeDBClickHouseOpsRequestStatusProgressingToLong | critical | 30m | An ops request has been running for 30+ minutes. |
KubeDBClickHouseOpsRequestFailed | critical | instant | An ops request failed. |
KubeStash Group
Only meaningful once KubeStash backup/restore is configured for this instance.
| Alert | Severity | For | What It Means |
|---|---|---|---|
ClickHouseKubeStashBackupSessionFailed | critical | instant | The most recent backup session failed. |
ClickHouseKubeStashRestoreSessionFailed | critical | instant | The most recent restore session failed. |
ClickHouseKubeStashNoBackupSessionForTooLong | warning | instant | No successful backup recorded recently. |
ClickHouseKubeStashRepositoryCorrupted | critical | 5m | Backup repository integrity check failed. |
ClickHouseKubeStashRepositoryStorageRunningLow | warning | 5m | Backup repository storage usage is high. |
ClickHouseKubeStashBackupSessionPeriodTooLong | warning | instant | A backup session is taking unusually long. |
ClickHouseKubeStashRestoreSessionPeriodTooLong | warning | instant | A restore session is taking unusually long. |
Customising Alerts
To override thresholds or disable specific alert groups, create a custom values file and upgrade the chart.
# custom-alerts.yaml
form:
  alert:
    labels:
      release: prometheus
    groups:
      database:
        enabled: warning
        rules:
          clickhouseTooManyConnections:
            enabled: true
            duration: "10m"
            severity: warning
      kubeStash:
        enabled: "none"    # disable if you don't use KubeStash
$ helm upgrade clickhouse-alert-demo appscode/clickhouse-alerts \
    -n alert-clickhouse \
    --version=v2026.7.14 \
    -f custom-alerts.yaml
Cleaning up
To remove all resources created in this tutorial, run the following commands.
# Remove the clickhouse-alerts release (PrometheusRule)
$ helm uninstall clickhouse-alert-demo -n alert-clickhouse

# Remove the ClickHouse instance
$ kubectl delete clickhouse -n alert-clickhouse clickhouse-alert-demo

# Delete namespace
$ kubectl delete ns alert-clickhouse

# Uninstall monitoring stack (optional — skip if other tutorials on this cluster still need them)
$ helm uninstall panopticon -n kubeops
$ helm uninstall prometheus -n monitoring
Next Steps
- Monitor your ClickHouse instance with KubeDB using built-in Prometheus.
- Monitor your ClickHouse instance with KubeDB using Prometheus operator.
- Want to hack on KubeDB? Check our contribution guidelines.