






































New to KubeDB? Please start here.
Qdrant Alerting with Prometheus
This tutorial shows you how to configure Prometheus-based alerting for a KubeDB-managed Qdrant instance using the qdrant-alerts Helm chart.
Before You Begin
Ensure you have a Kubernetes cluster and that
kubectlis configured to communicate with it. If you do not already have a cluster, you can create one using kind.Install the KubeDB operator by following the steps here.
Deploy the database in the
demonamespace:$ kubectl create ns demo namespace/demo createdThis tutorial assumes you already have a kube-prometheus-stack running in your cluster, with
Prometheusconfigured so that bothserviceMonitorSelectorandruleSelectormatch the labelrelease: prometheus. See the Grafana Dashboard guide for how to deploy kube-prometheus-stack if you don’t have it yet.To verify the selectors:
$ kubectl get prometheus -n monitoring -o jsonpath='{.items[0].spec.ruleSelector}'
{"matchLabels":{"release":"prometheus"}}

$ kubectl get prometheus -n monitoring -o jsonpath='{.items[0].spec.serviceMonitorSelector}'
{"matchLabels":{"release":"prometheus"}}
To learn more about how Prometheus monitoring works with KubeDB, see the overview here.
For dashboards and visualisation, see Grafana Dashboard for Qdrant. Note that, at the time of writing, the
kubedb-grafana-dashboardschart does not yet ship dedicated Qdrant dashboards — the link is provided for consistency with other KubeDB database guides and will render dashboards once they are added upstream.
Note: YAML files used in this tutorial are stored in docs/examples/qdrant folder in GitHub repository kubedb/docs.
Overview
- KubeDB deploys Qdrant with metrics served natively by Qdrant itself on its API port (
6333) — no separate exporter sidecar is required. - ServiceMonitor (named
{qdrant-name}-stats) is created automatically by KubeDB and tells Prometheus to scrape the metrics endpoint every 10 seconds. It is pre-configured to send a Bearer token (read from the{qdrant-name}-authSecret’sapi-keykey) with every scrape request, since Qdrant’s/metricsendpoint requires authentication. - PrometheusRule is created by the
qdrant-alertschart and contains all Qdrant alert definitions grouped by concern: database health and provisioner. - Prometheus Operator evaluates every rule expression every 30 seconds and fires matching alerts to AlertManager.
- AlertManager groups, inhibits, and silences alerts, then routes them to configured receivers (Slack, email, PagerDuty, webhook, etc.).
Deploy Qdrant with Monitoring Enabled
At first, let’s deploy a Qdrant database with monitoring enabled. Below is the Qdrant object we are going to create.
apiVersion: kubedb.com/v1alpha2
kind: Qdrant
metadata:
  name: qd-alert-demo
  namespace: demo
spec:
  version: "1.17.0"
  storage:
    storageClassName: "local-path"
    accessModes:
    - ReadWriteOnce
    resources:
      requests:
        storage: 1Gi
  monitor:
    agent: prometheus.io/operator
    prometheus:
      exporter:
        port: 6333
      serviceMonitor:
        interval: 10s
        labels:
          release: prometheus
  deletionPolicy: WipeOut
Here,
spec.monitor.agent: prometheus.io/operatortells KubeDB to create aServiceMonitorresource managed by the Prometheus operator.spec.monitor.prometheus.exporter.port: 6333tells KubeDB which port to scrape metrics from — Qdrant’s own API port.spec.monitor.prometheus.serviceMonitor.labels.release: prometheusadds therelease: prometheuslabel to the createdServiceMonitor, matching the PrometheusserviceMonitorSelectorso the target is discovered automatically.
Let’s create the Qdrant resource.
$ kubectl apply -f https://github.com/kubedb/docs/raw/v2026.6.19/docs/examples/qdrant/monitoring/qdrant-monitoring.yaml
qdrant.kubedb.com/qd-alert-demo created
Now, wait for the database to go into Ready state.
$ kubectl get qdrant -n demo qd-alert-demo
NAME            VERSION   STATUS   AGE
qd-alert-demo   1.17.0    Ready    37s
KubeDB creates a dedicated stats service with the -stats suffix for monitoring.
$ kubectl get svc -n demo --selector="app.kubernetes.io/instance=qd-alert-demo"
NAME                  TYPE        CLUSTER-IP      EXTERNAL-IP   PORT(S)             AGE
qd-alert-demo         ClusterIP   10.43.182.24    <none>        6333/TCP,6334/TCP   43s
qd-alert-demo-pods    ClusterIP   None            <none>        6335/TCP            43s
qd-alert-demo-stats   ClusterIP   10.43.199.143   <none>        6333/TCP            43s
KubeDB also creates a ServiceMonitor that tells Prometheus where to scrape.
$ kubectl get servicemonitor -n demo
NAME                  AGE
qd-alert-demo-stats   40s
Verify that the ServiceMonitor carries the release: prometheus label so Prometheus discovers it.
$ kubectl get servicemonitor -n demo qd-alert-demo-stats \
    -o jsonpath='{.metadata.labels.release}'
prometheus
Because Qdrant’s /metrics endpoint requires authentication, KubeDB pre-wires the ServiceMonitor’s scrape endpoint with a Bearer token sourced from the {qdrant-name}-auth Secret:
$ kubectl get servicemonitor -n demo qd-alert-demo-stats -o jsonpath='{.spec.endpoints[0].authorization}'
{"credentials":{"key":"api-key","name":"qd-alert-demo-auth"},"type":"Bearer"}
No manual credential wiring is required — Prometheus authenticates automatically.
Step 1 — Install qdrant-alerts
The qdrant-alerts chart creates a PrometheusRule resource containing all Qdrant alert definitions grouped by concern: database health and provisioner.
Why the Helm release name matters
The chart derives the PromQL job/instance scoping (and the PrometheusRule name) from the Helm release name, not from a values field — so the release name must match the Qdrant object’s name (qd-alert-demo) for the rules to be correctly scoped to this instance. Do not use --set metadata.release.name=... to try to achieve this — that values field is a no-op for query scoping; only the actual Helm release name (the first positional argument to helm upgrade -i) is used by the chart’s templates.
The chart’s default label is release: prometheus already, matching the Prometheus ruleSelector on this cluster, but we set it explicitly below for clarity and portability.
Install
$ helm upgrade -i qd-alert-demo oci://ghcr.io/appscode-charts/qdrant-alerts \
    -n demo \
    --create-namespace \
    --version=v2026.7.14 \
    --set form.alert.labels.release=prometheus
| Flag | Value | Purpose |
|---|---|---|
qd-alert-demo (release name) | — | Scopes every PromQL expression to this instance (job="qd-alert-demo-stats") |
-n demo | demo | Installs the PrometheusRule in the same namespace as the database |
form.alert.labels.release | prometheus | Matches the Prometheus ruleSelector so the rules are loaded |
Verify the PrometheusRule is created
$ kubectl get prometheusrule -n demo
NAME            AGE
qd-alert-demo   30s
Confirm the release: prometheus label is present.
$ kubectl get prometheusrule -n demo qd-alert-demo \
    -o jsonpath='{.metadata.labels.release}'
prometheus
Confirm Prometheus loaded the rules
Port-forward the Prometheus UI and open the Status → Rule health page.
$ kubectl port-forward -n monitoring \
    svc/prometheus-kube-prometheus-prometheus 9090:9090
Open http://localhost:9090/rules?search=qdrant.
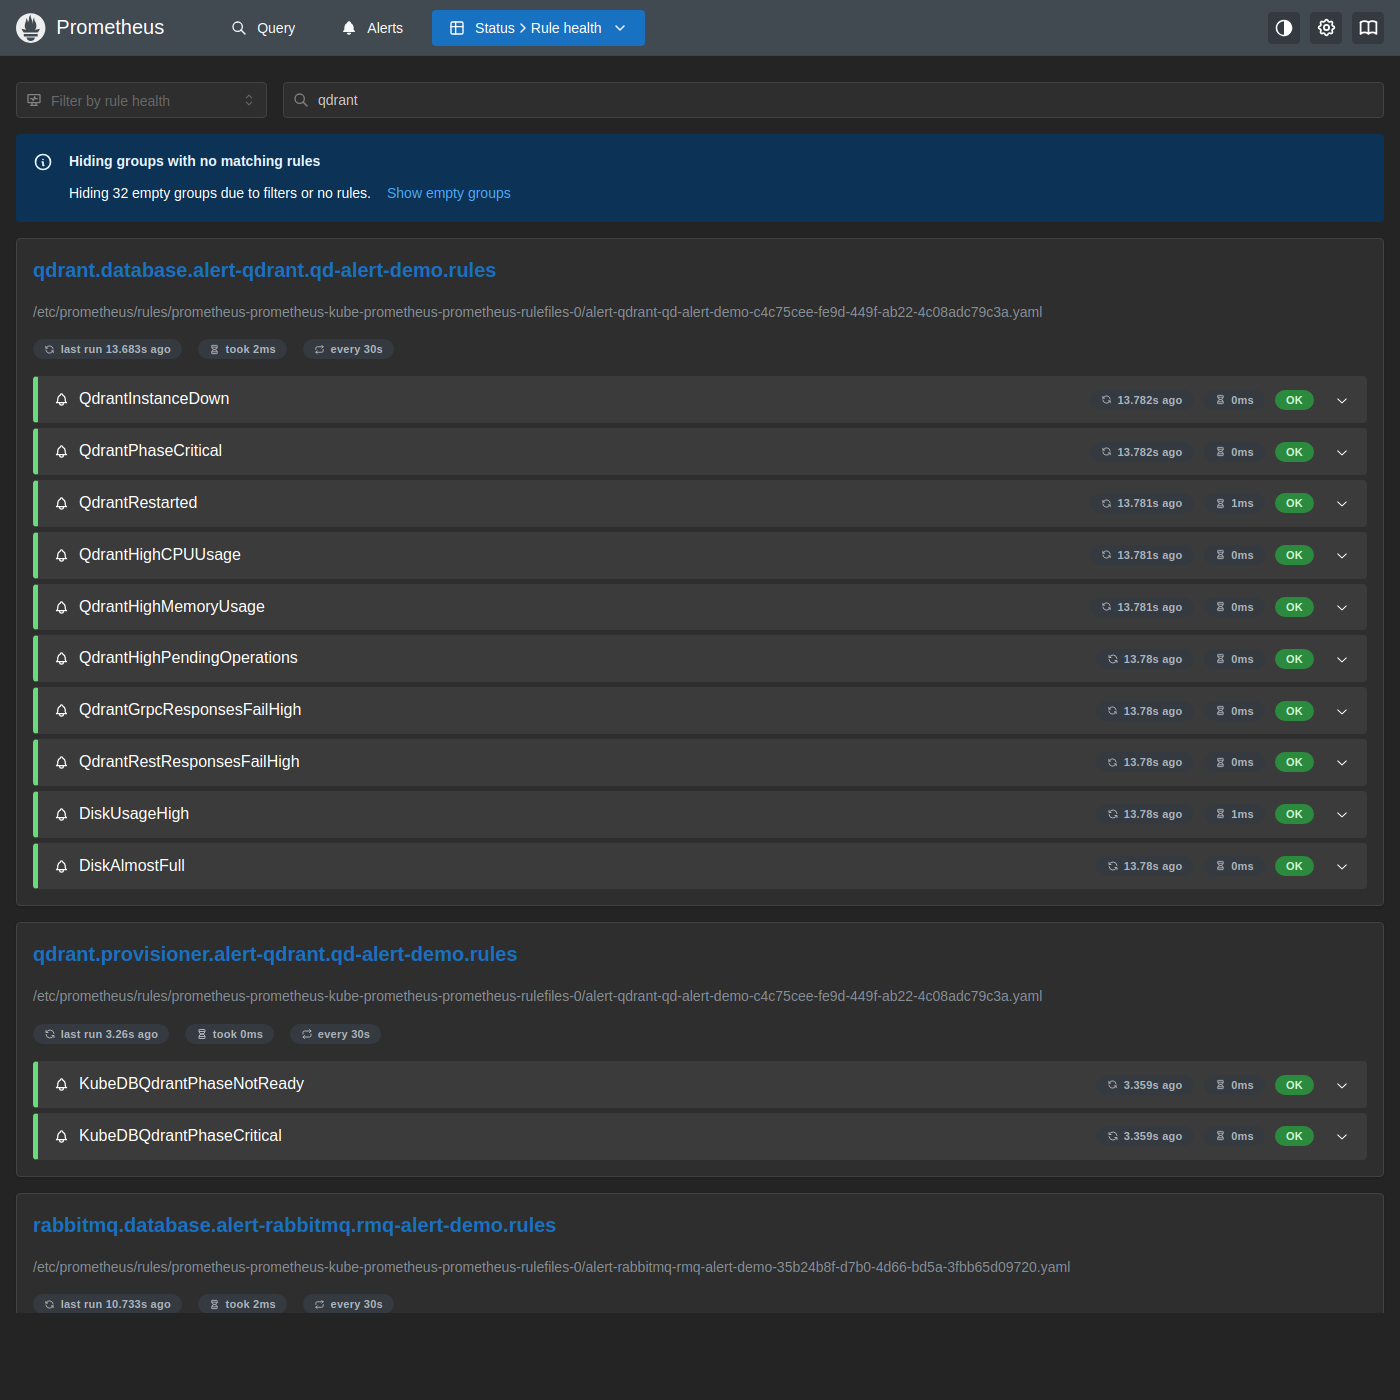
Both the qdrant.database.demo.qd-alert-demo.rules and qdrant.provisioner.demo.qd-alert-demo.rules groups are visible with all rules showing OK, confirming that Prometheus has loaded and is evaluating the Qdrant alert definitions every 30 seconds.
Verify End-to-End
1. Check the metrics endpoint is reachable
Qdrant serves its own metrics; there is no separate exporter sidecar to check. Because the endpoint requires a Bearer token, fetch the API key from the auth Secret first.
$ kubectl get secret -n demo qd-alert-demo-auth -o jsonpath='{.data.api-key}' | base64 -d
38XLVOctmGr5lQzT
$ kubectl port-forward -n demo svc/qd-alert-demo-stats 6333:6333 &
$ curl -s -H "Authorization: Bearer 38XLVOctmGr5lQzT" localhost:6333/metrics | head -5
# HELP app_info information about qdrant server
# TYPE app_info gauge
app_info{name="qdrant",version="1.17.0"} 1
# HELP collections_total number of collections
# TYPE collections_total gauge
A successful 200 response with Qdrant metrics confirms Prometheus can scrape this endpoint using the same Bearer token wired into the ServiceMonitor.
2. Check the Prometheus target is UP
Open http://localhost:9090/targets?search=qd-alert-demo.
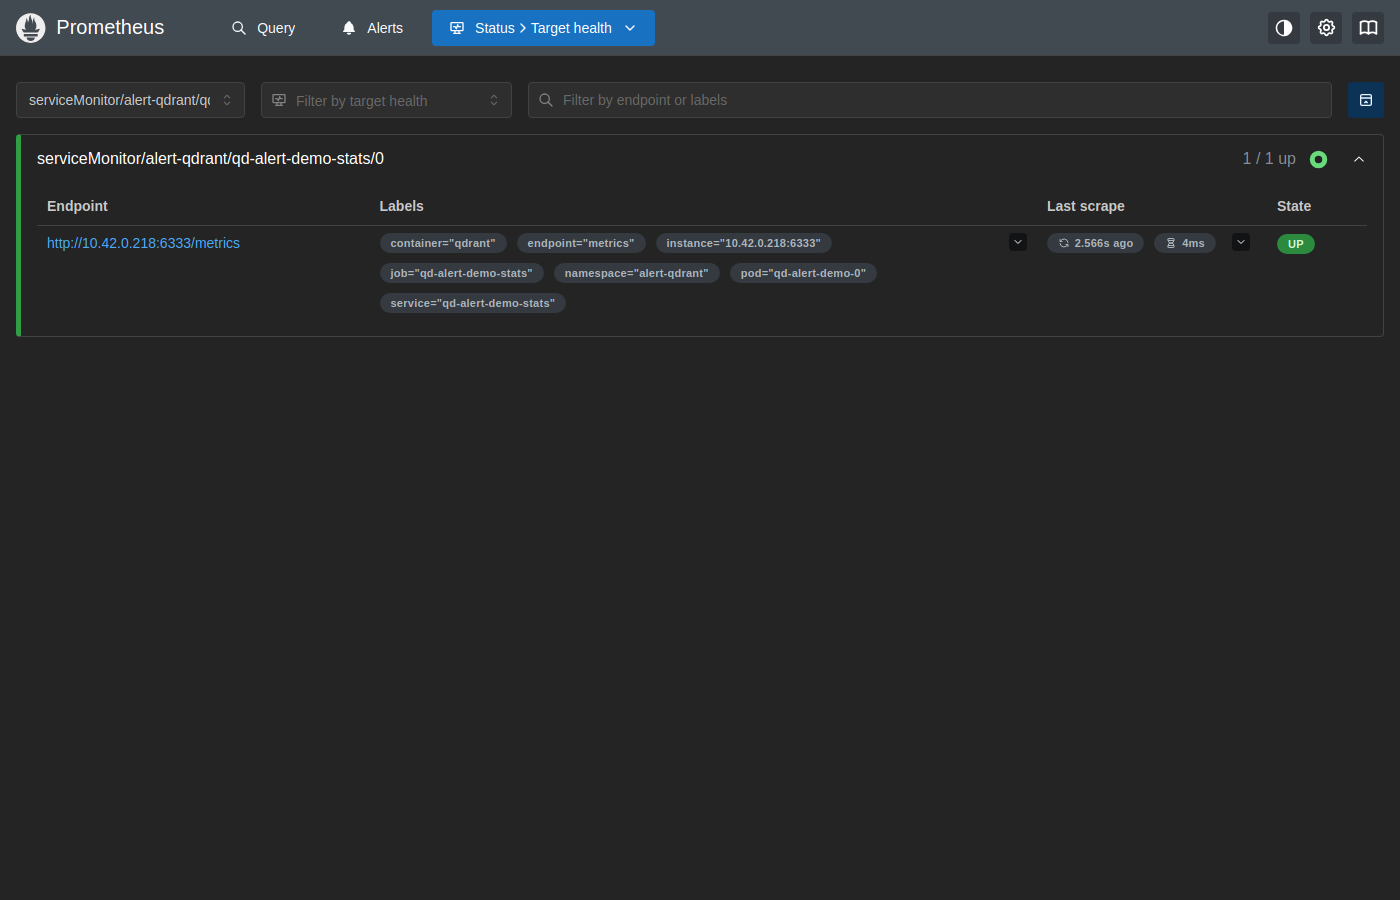
The target serviceMonitor/demo/qd-alert-demo-stats/0 shows UP, confirming metrics are being scraped from qd-alert-demo-0 in the demo namespace.
3. Confirm Qdrant alerts
Open http://localhost:9090/alerts?search=qdrant to see the Qdrant alert groups.
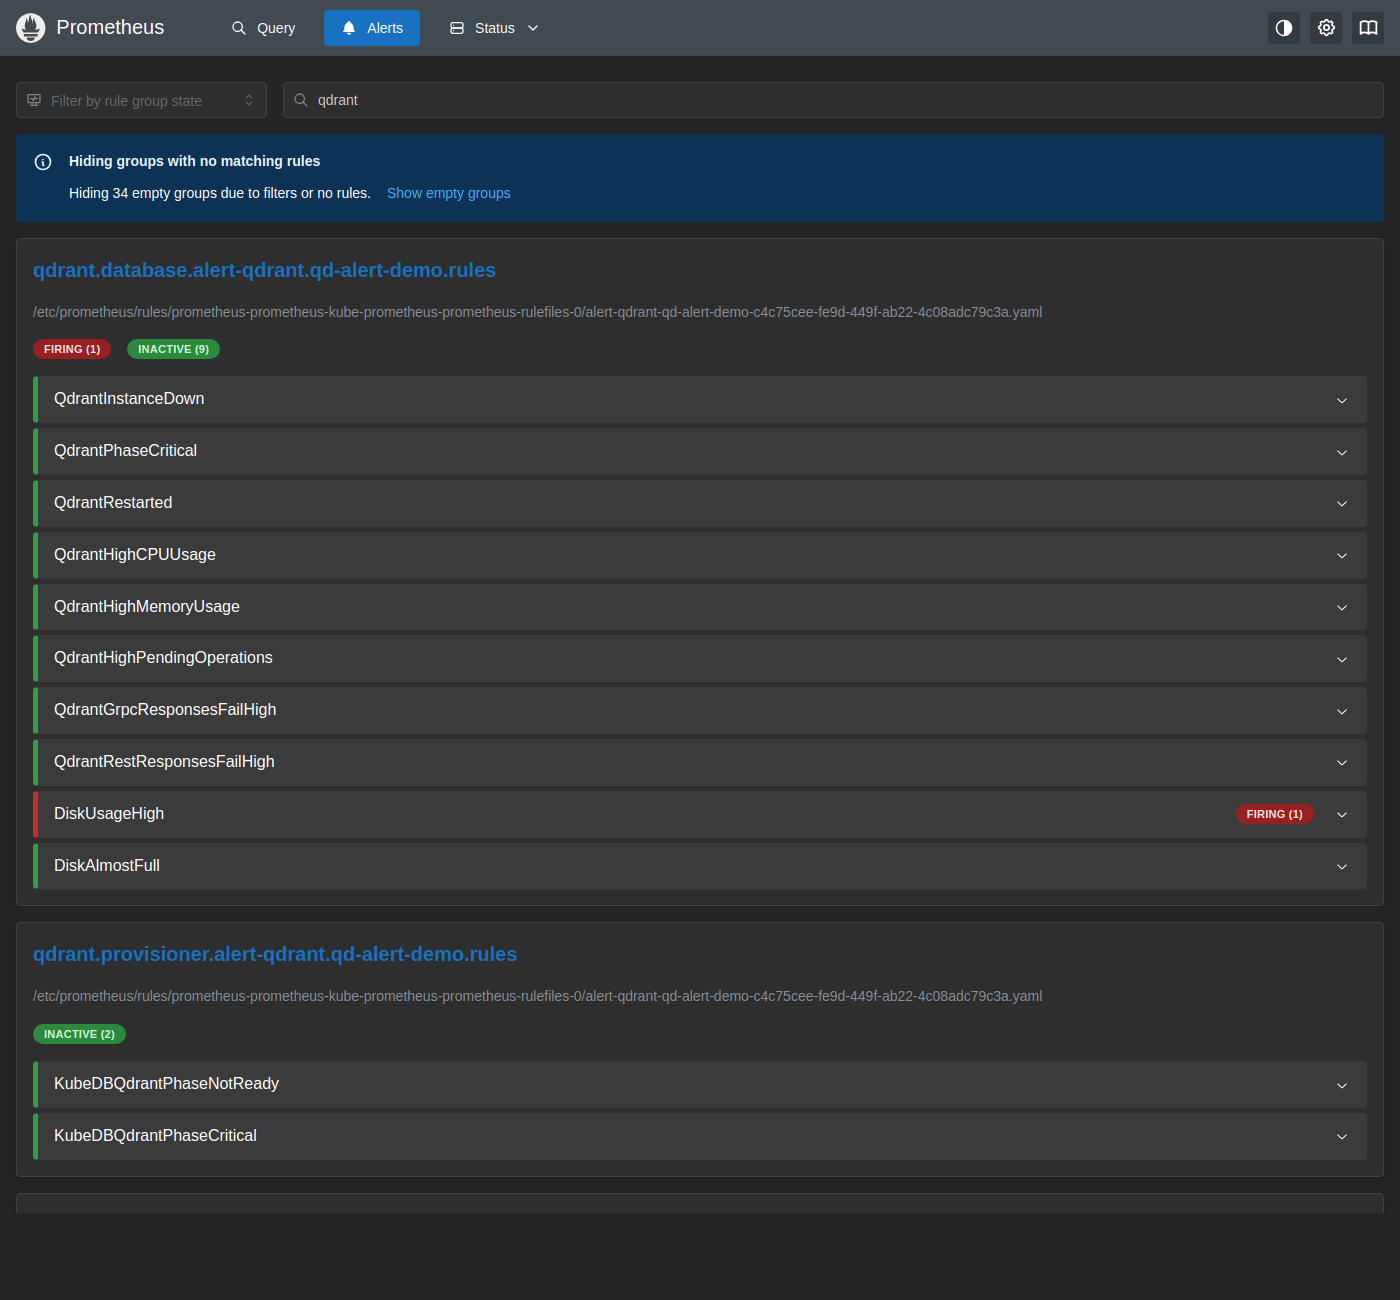
Most rules in the qdrant.database group show INACTIVE, meaning the corresponding thresholds are not breached. On the live cluster used to capture this screenshot, DiskUsageHigh was genuinely FIRING — the local-path StorageClass reports the underlying node filesystem’s usage/capacity rather than the PVC’s logical 1Gi request, and the shared demo node happened to be above the 80% threshold at the time. This is a real, useful illustration of the alert doing its job: it is not specific to Qdrant, but to any workload using local-path on a node with high disk utilization. In production, prefer a StorageClass that enforces real capacity accounting (e.g. most CSI drivers) if you rely on DiskUsageHigh/DiskAlmostFull for capacity planning.
4. Check AlertManager
Port-forward AlertManager to view any currently firing alerts.
$ kubectl port-forward -n monitoring \
    svc/prometheus-kube-prometheus-alertmanager 9093:9093
Open http://localhost:9093. With a healthy Qdrant instance, only pre-existing environmental alerts (such as DiskUsageHigh, if applicable to your node) will be listed here — no Qdrant-availability alert should be present.
Simulating a Firing Alert
This section walks through deliberately triggering the QdrantInstanceDown critical alert so you can observe the full alert lifecycle — from firing in Prometheus through to the AlertManager dashboard — and then resolve it.
1. Stop the Qdrant process
The Qdrant pod runs a single container (no exporter sidecar), and its main process runs as PID 1. A plain kill 1 isn’t available since the image ships no kill binary, so use the bash built-in instead. A single SIGTERM restarts fast enough (well under one 10s scrape interval) that Prometheus may never observe a failed scrape, so repeat the signal a few times to keep the container down for longer than the alert’s for: 30s window:
$ for i in $(seq 1 15); do
    kubectl exec -n demo qd-alert-demo-0 -c qdrant -- bash -c 'kill -TERM 1'
    sleep 3
  done
This repeatedly restarts the container faster than it can finish starting up, eventually pushing it into CrashLoopBackOff, which keeps the metrics endpoint unreachable for well over 30 seconds.
$ kubectl get pod -n demo qd-alert-demo-0
NAME              READY   STATUS      RESTARTS      AGE
qd-alert-demo-0   0/1     Completed   3 (30s ago)   56m
Wait 30–60 seconds for the next Prometheus scrape cycle (configured at 10s) and rule-evaluation cycle (30s) to register the failure.
2. Watch the alert fire in Prometheus
Open http://localhost:9090/alerts?search=qdrant.
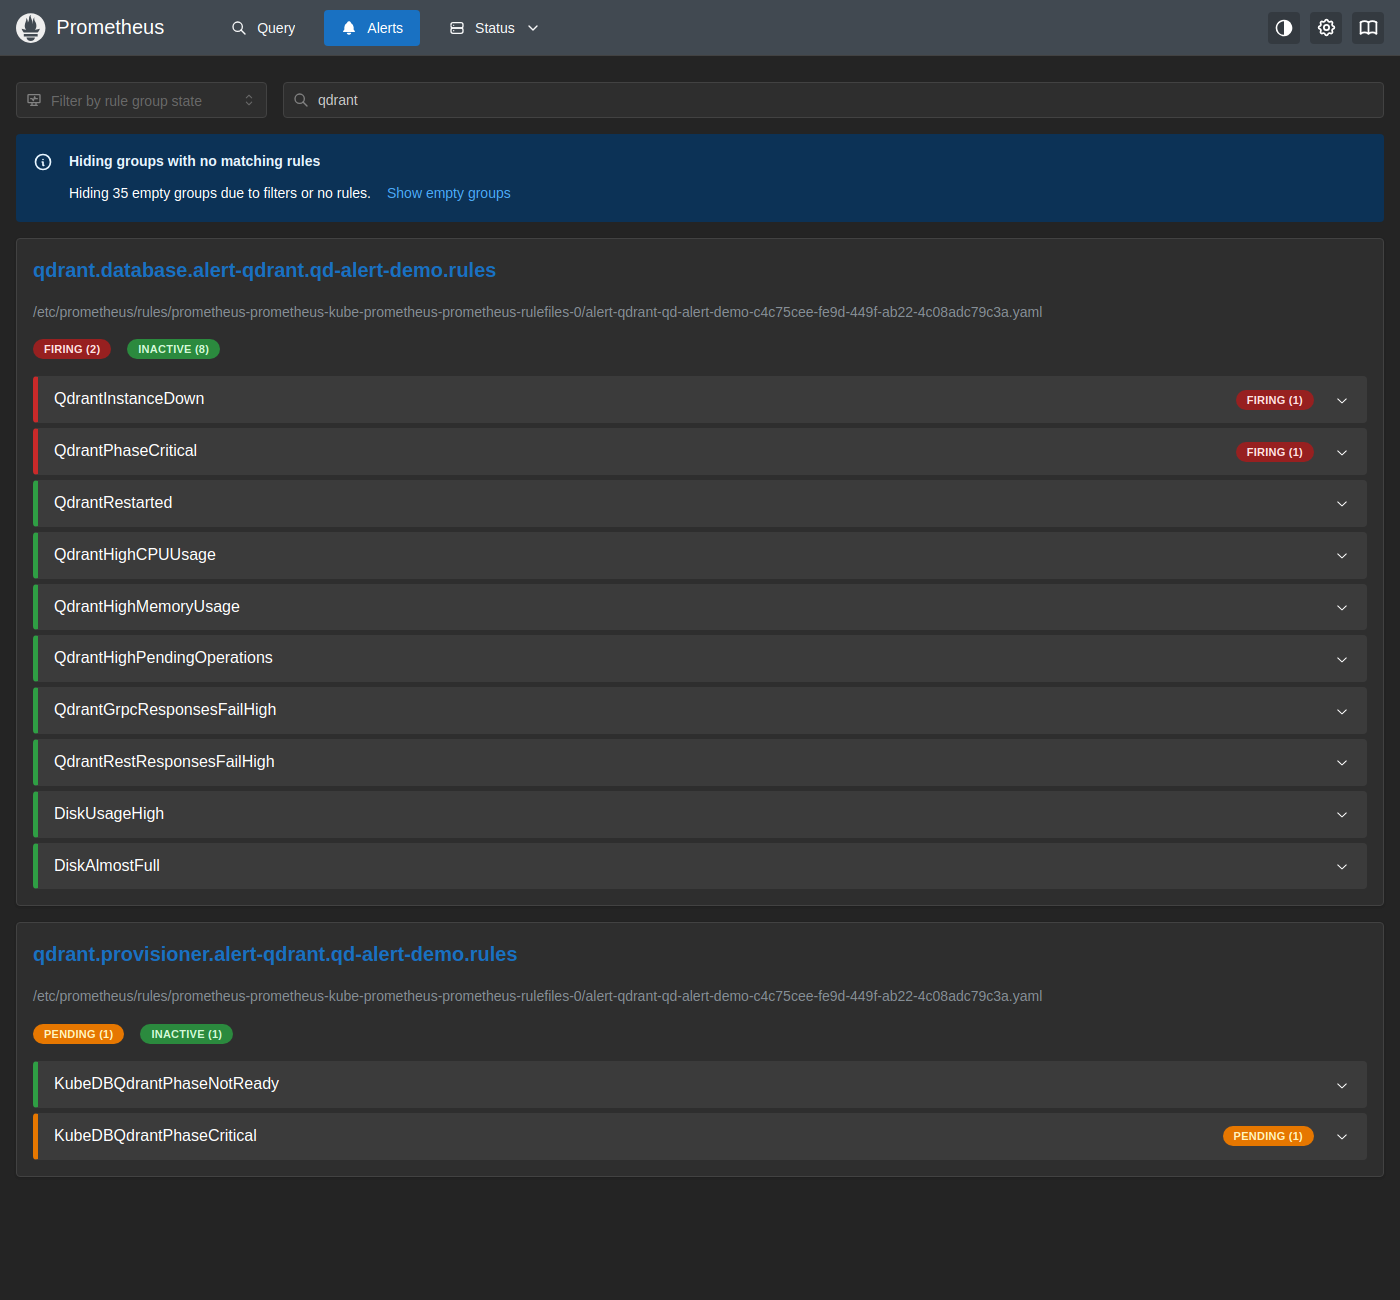
Both QdrantInstanceDown (the scrape-target-down alert, for: 30s) and QdrantPhaseCritical (driven by the KubeDB operator’s own view of the resource phase, for: 1m) move to FIRING once their respective durations elapse.
3. Check the AlertManager dashboard
Open http://localhost:9093.
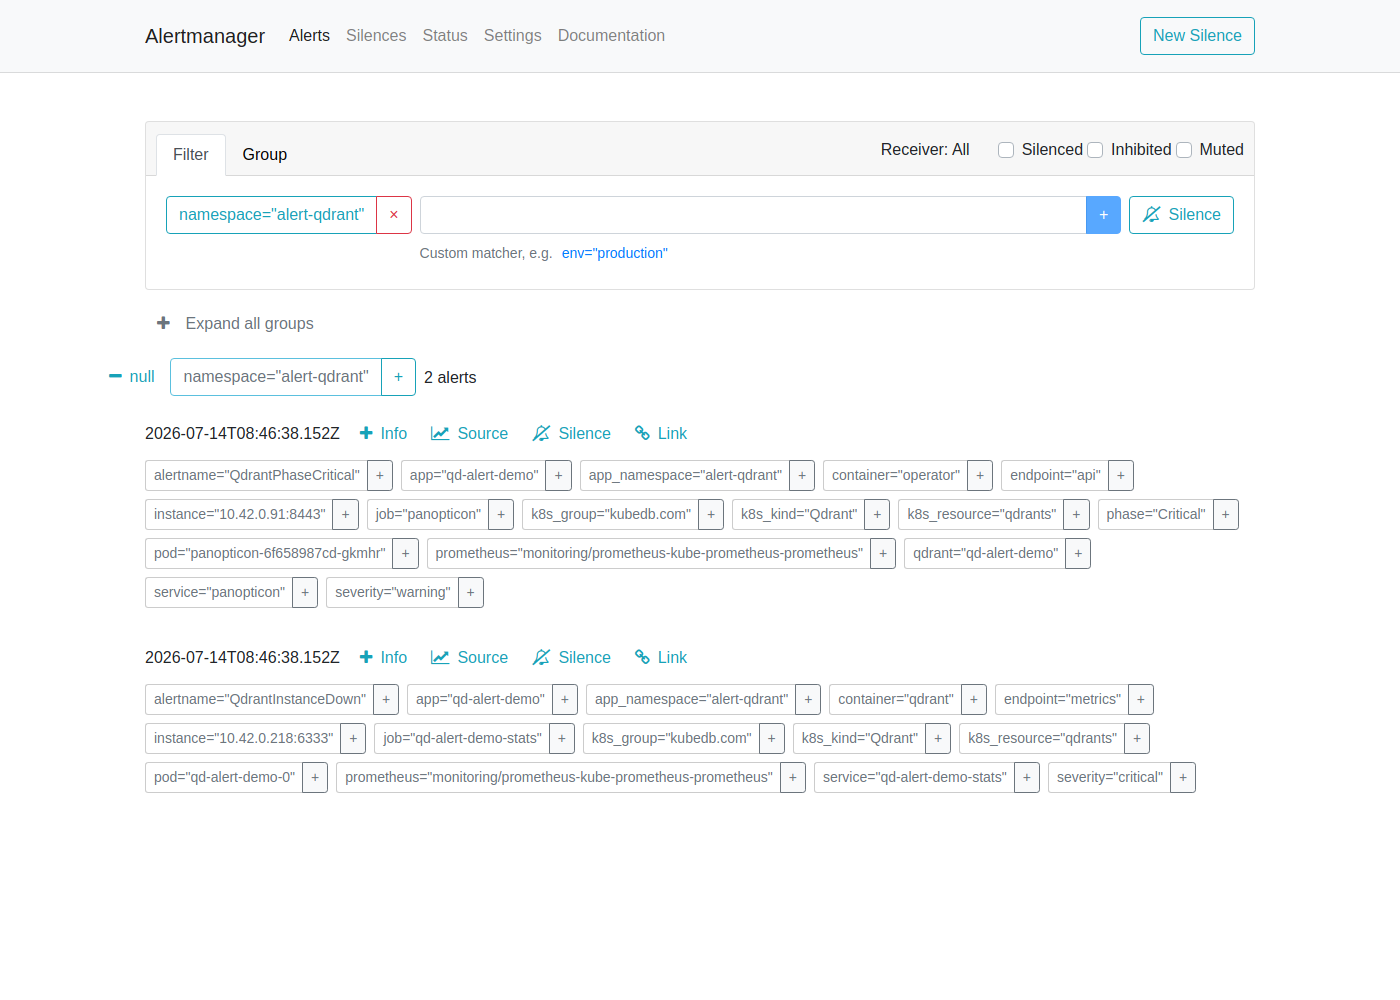
AlertManager shows the QdrantInstanceDown alert. The alert card displays:
- Severity:
critical - Instance:
qd-alert-demo-0in thealert-qdrantnamespace - job:
qd-alert-demo-stats - Started: timestamp when the alert first fired
AlertManager routes this alert to every receiver configured in your alertmanagerConfig (Slack, email, PagerDuty, webhook, etc.) based on your routing tree. If no receiver is configured, the alert is visible here but silently dropped.
4. Restore Qdrant
Delete the pod so KubeDB recreates it cleanly.
$ kubectl delete pod -n demo qd-alert-demo-0
Once the metrics target returns to up, Prometheus marks the alerts INACTIVE again and AlertManager sends a resolved notification to all receivers.
Alert Reference
All alerts are scoped to the qd-alert-demo instance in the demo namespace via PromQL label filters such as job="qd-alert-demo-stats", app="qd-alert-demo", and namespace="demo".
Database Group
Fired based on live metrics from Qdrant itself, the KubeDB operator’s status reporting, and node-level cAdvisor/kubelet metrics.
| Alert | Severity | For | What It Means |
|---|---|---|---|
QdrantInstanceDown | critical | 30s | The database is in NotReady phase — not accepting connections; read/write operations are failing. |
QdrantPhaseCritical | warning | 1m | The database is in Critical phase — one or more nodes are experiencing issues but the database is still operational. |
QdrantRestarted | warning | 1m | The database service restarted recently (uptime under 180s). |
QdrantHighCPUUsage | warning | 1m | Database CPU usage (ratio of usage to limits) exceeds 80%. |
QdrantHighMemoryUsage | warning | 1m | Database memory usage (ratio of working set to limits) exceeds 80%. |
DiskUsageHigh | warning | 1m | Persistent volume usage exceeds 80% — storage is running low and may need expansion soon. |
DiskAlmostFull | critical | 1m | Persistent volume usage exceeds 95% — storage is critically low; immediate action is required to avoid data loss. |
QdrantHighPendingOperations | critical | 5m | The number of pending operations on a pod exceeds 10 — a backlog is building up. |
QdrantGrpcResponsesFailHigh | critical | 5m | More than 5 failed gRPC responses in the last 5 minutes on a pod. |
QdrantRestResponsesFailHigh | critical | 5m | More than 5 failed REST responses in the last 5 minutes on a pod. |
Provisioner Group
Monitors the KubeDB operator’s view of the Qdrant resource phase.
| Alert | Severity | For | What It Means |
|---|---|---|---|
appPhaseNotReady (alert name KubeDBQdrantPhaseNotReady) | critical | 1m | KubeDB marked the Qdrant resource NotReady — the database is not accepting connections and requires attention. |
appPhaseCritical (alert name KubeDBQdrantPhaseCritical) | warning | 15m | The instance is in a degraded/critical phase — one or more nodes are experiencing issues but the database is still operational. |
Customising Alerts
To override thresholds or disable specific alert groups, create a custom values file and upgrade the chart.
# custom-alerts.yaml
form:
  alert:
    labels:
      release: prometheus
    groups:
      database:
        enabled: warning
        rules:
          qdrantHighCPUUsage:
            enabled: true
            duration: "5m"
            val: 90        # fire at 90% CPU instead of the default 80%
            severity: warning
          diskUsageHigh:
            enabled: true
            val: 90        # raise the disk-usage warning threshold to 90%
            duration: "1m"
            severity: warning
      provisioner:
        enabled: "none"    # disable all provisioner alerts
$ helm upgrade qd-alert-demo oci://ghcr.io/appscode-charts/qdrant-alerts \
    -n demo \
    --version=v2026.7.14 \
    -f custom-alerts.yaml
Cleaning up
To remove all resources created in this tutorial, run the following commands.
# Remove the qdrant-alerts release
$ helm uninstall qd-alert-demo -n demo

# Remove the Qdrant instance
$ kubectl delete qdrant -n demo qd-alert-demo

# Delete namespace
$ kubectl delete ns demo
Next Steps
- Monitor your Qdrant database with KubeDB using Prometheus operator.
- Visualise Qdrant metrics with Grafana Dashboard.
- Detail concepts of Qdrant object.
- Want to hack on KubeDB? Check our contribution guidelines.