









































New to KubeDB? Please start here.
Pgpool Alerting with Prometheus
This tutorial shows you how to configure Prometheus-based alerting for a KubeDB-managed Pgpool instance using the pgpool-alerts Helm chart.
Before You Begin
Ensure you have a Kubernetes cluster and that
kubectlis configured to communicate with it. If you do not already have a cluster, you can create one using kind.Install the KubeDB operator by following the steps here.
Deploy the database in the
alert-pgpoolnamespace:$ kubectl create ns alert-pgpool namespace/alert-pgpool createdBefore proceeding, complete the Configuration steps to deploy kube-prometheus-stack and Panopticon.
This tutorial assumes you already have a kube-prometheus-stack running in your cluster, with
Prometheusconfigured so that bothserviceMonitorSelectorandruleSelectormatch the labelrelease: prometheus.To verify the selectors:
$ kubectl get prometheus -n monitoring -o jsonpath='{.items[0].spec.ruleSelector}'
{"matchLabels":{"release":"prometheus"}}

$ kubectl get prometheus -n monitoring -o jsonpath='{.items[0].spec.serviceMonitorSelector}'
{"matchLabels":{"release":"prometheus"}}
To learn more about how Prometheus monitoring works with KubeDB, see the overview here.
Pgpool is a connection pooler/load balancer in front of a PostgreSQL backend, so this tutorial first deploys a single-node PostgreSQL instance, then a Pgpool instance pointed at it. Both objects are deployed with monitoring enabled.
Note: YAML files used in this tutorial are stored in docs/examples/pgpool folder in GitHub repository kubedb/docs.
Overview
- KubeDB deploys Pgpool with a dedicated
pgpool2_exportersidecar (container nameexporter) that exposes metrics on port9719— Pgpool itself has no built-in Prometheus endpoint, so every pod runs two containers:pgpoolandexporter. - ServiceMonitor (named
{pgpool-name}-stats) is created automatically by KubeDB and tells Prometheus to scrape the exporter every 10 seconds. - PrometheusRule is created by the
pgpool-alertschart and contains Pgpool alert definitions grouped by concern: database health and provisioner. - Prometheus Operator evaluates every rule expression every 30 seconds and fires matching alerts to AlertManager.
- AlertManager groups, inhibits, and silences alerts, then routes them to configured receivers (Slack, email, PagerDuty, webhook, etc.).
- Grafana dashboards for Pgpool are covered separately — see Grafana Dashboard rather than duplicated here.
Deploy the PostgreSQL Backend
Pgpool pools/load-balances connections to a PostgreSQL instance, so deploy the backend first.
apiVersion: kubedb.com/v1
kind: Postgres
metadata:
  name: pg-backend-alert
  namespace: alert-pgpool
spec:
  version: "16.13"
  replicas: 1
  storageType: Durable
  storage:
    storageClassName: "local-path"
    accessModes:
      - ReadWriteOnce
    resources:
      requests:
        storage: 1Gi
  configuration:
    inline:
      user.conf: |
        max_connections=200
  deletionPolicy: WipeOut
Here, spec.configuration.inline raises max_connections from the default 100 to 200. This isn’t optional — see the note below.
Why
max_connectionsmust be raised: thePgpooladmission webhook enforces2 * num_init_children * replicas * max_pool <= backend max_connections, and separately requiresmax_pool >= 15 * replicasandnum_init_children >= 5. Combining the two minimums (num_init_children=5,max_pool=15) already requires2*5*1*15 = 150backend connections — more than PostgreSQL’s stock default of 100. Deploying Pgpool against an unmodified default-config Postgres backend fails validation outright withtotal connection for pgpool exceed max backend connection. Bumping the backend tomax_connections=200(or higher) is the simplest fix.
$ kubectl apply -f https://github.com/kubedb/docs/raw/v2026.6.19/docs/examples/pgpool/monitoring/pg-backend-alert.yaml
postgres.kubedb.com/pg-backend-alert created
Wait for the PostgreSQL instance to go into Ready state.
$ kubectl get postgres -n alert-pgpool pg-backend-alert
NAME               VERSION   STATUS   AGE
pg-backend-alert   16.13     Ready    3m
Deploy Pgpool with Monitoring Enabled
Now deploy Pgpool, pointing spec.postgresRef at the PostgreSQL instance above.
apiVersion: kubedb.com/v1alpha2
kind: Pgpool
metadata:
  name: pgpool-alert
  namespace: alert-pgpool
spec:
  version: "4.5.3"
  postgresRef:
    name: pg-backend-alert
    namespace: alert-pgpool
  configuration:
    inline:
      pgpool.conf: |
        num_init_children=5
        max_pool=15
  deletionPolicy: WipeOut
  monitor:
    agent: prometheus.io/operator
    prometheus:
      serviceMonitor:
        labels:
          release: prometheus
        interval: 10s
Here,
spec.postgresReftells Pgpool which KubeDB Postgres object to pool/load-balance connections for.spec.configuration.inlinesetsnum_init_children/max_poolto the minimum values the admission webhook accepts (see the note above) — matched against the backend’smax_connections=200.spec.monitor.agent: prometheus.io/operatortells KubeDB to create aServiceMonitorresource managed by the Prometheus operator.spec.monitor.prometheus.serviceMonitor.labels.release: prometheusadds therelease: prometheuslabel to the createdServiceMonitor, matching the PrometheusserviceMonitorSelectorso the target is discovered automatically.
$ kubectl apply -f https://github.com/kubedb/docs/raw/v2026.6.19/docs/examples/pgpool/monitoring/pgpool-alert.yaml
pgpool.kubedb.com/pgpool-alert created
Now, wait for Pgpool to go into Ready state.
$ kubectl get pgpool -n alert-pgpool pgpool-alert
NAME           VERSION   STATUS   AGE
pgpool-alert   4.5.3     Ready    40s
KubeDB creates a dedicated stats service with the -stats suffix for monitoring.
$ kubectl get svc -n alert-pgpool --selector="app.kubernetes.io/instance=pgpool-alert"
NAME                 TYPE        CLUSTER-IP      EXTERNAL-IP   PORT(S)             AGE
pgpool-alert         ClusterIP   10.43.6.157     <none>        9999/TCP,9595/TCP   40s
pgpool-alert-pods    ClusterIP   None            <none>        9999/TCP            40s
pgpool-alert-stats   ClusterIP   10.43.248.150   <none>        9719/TCP            40s
KubeDB also creates a ServiceMonitor that tells Prometheus where to scrape.
$ kubectl get servicemonitor -n alert-pgpool
NAME                 AGE
pgpool-alert-stats   40s
Verify that the ServiceMonitor carries the release: prometheus label so Prometheus discovers it.
$ kubectl get servicemonitor -n alert-pgpool pgpool-alert-stats \
    -o jsonpath='{.metadata.labels.release}'
prometheus
Step 1 — Install pgpool-alerts
The pgpool-alerts chart creates a PrometheusRule resource containing Pgpool alert definitions grouped by concern.
Why the Helm release name matters
The chart derives the PrometheusRule name and scopes every PromQL expression (via job="{release-name}-stats" / app="{release-name}") from the Helm release name — so the release name must match the Pgpool object’s name (pgpool-alert) for the rules to be correctly scoped to this instance.
The chart’s default label is release: kube-prometheus-stack, so we must also override it at install time to match the Prometheus ruleSelector.
Install
$ helm upgrade -i pgpool-alert oci://ghcr.io/appscode-charts/pgpool-alerts \
    -n alert-pgpool \
    --create-namespace \
    --version=v2026.7.14 \
    --set form.alert.labels.release=prometheus
| Flag | Value | Purpose |
|---|---|---|
pgpool-alert (release name) | — | Scopes every PromQL expression to this instance (job="pgpool-alert-stats", app="pgpool-alert") |
-n alert-pgpool | alert-pgpool | Installs the PrometheusRule in the same namespace as the database |
form.alert.labels.release | prometheus | Matches the Prometheus ruleSelector so the rules are loaded |
Verify the PrometheusRule is created
$ kubectl get prometheusrule -n alert-pgpool
NAME           AGE
pgpool-alert   30s
Confirm the release: prometheus label is present.
$ kubectl get prometheusrule -n alert-pgpool pgpool-alert \
    -o jsonpath='{.metadata.labels.release}'
prometheus
Chart gap found: like several other
*-alertscharts,values.yamlalso declares anopsManageralert group (opsRequestFailed,opsRequestOnProgress,opsRequestStatusProgressingToLong), but only thedatabaseandprovisionergroups are actually rendered into the livePrometheusRuleat chart versionv2026.7.14. Cross-checkhelm show valuesagainstkubectl get prometheusrule ... -o yamlrather than assuming every documented group is loaded.
Confirm Prometheus loaded the rules
Port-forward the Prometheus UI.
$ kubectl port-forward -n monitoring \
    svc/prometheus-kube-prometheus-prometheus 9090:9090
Open http://localhost:9090/rules and locate the pgpool.database and pgpool.provisioner groups.
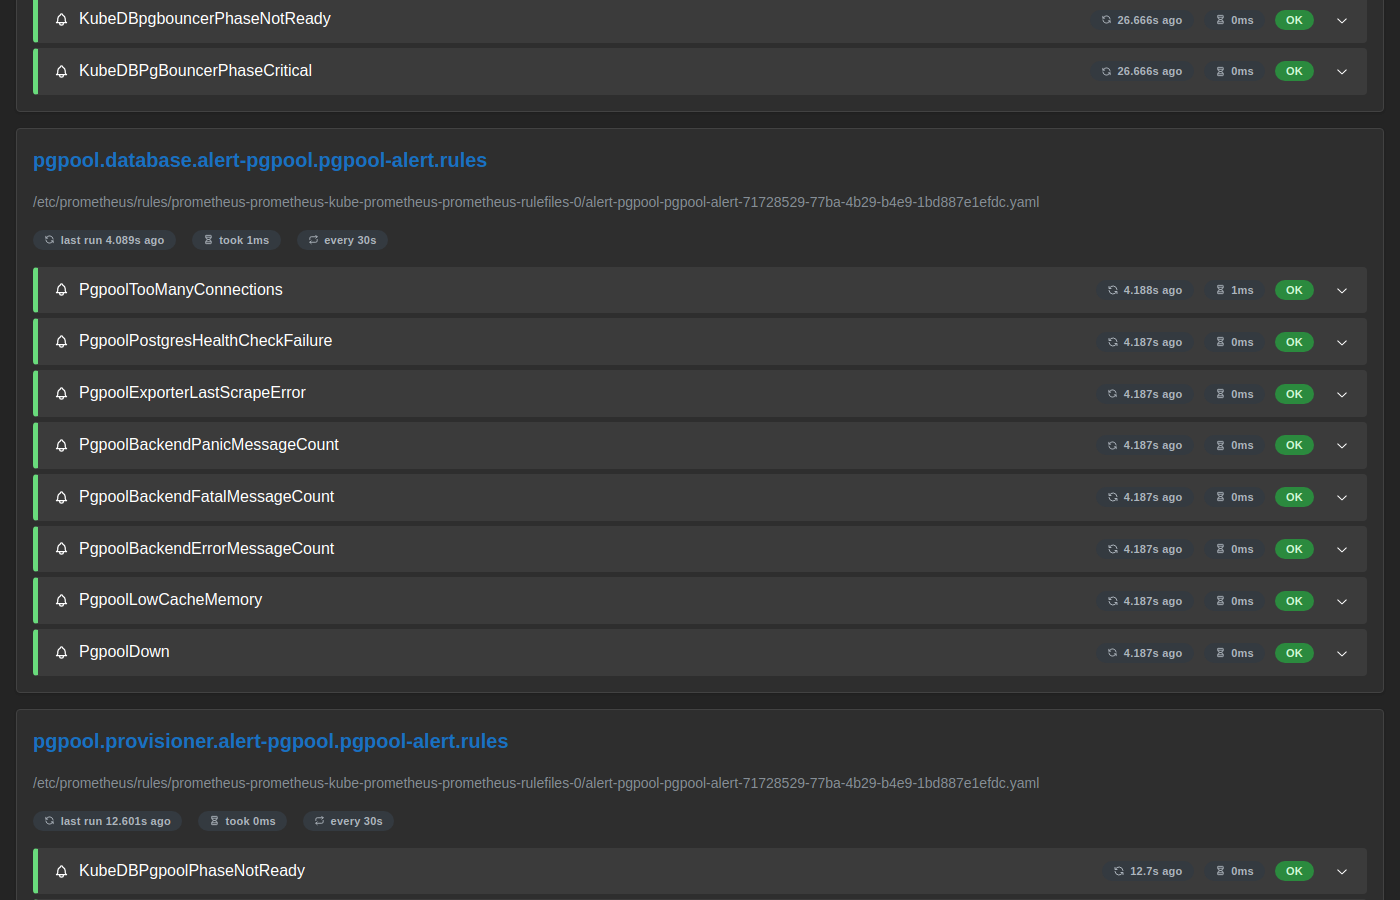
Both groups are visible with all 10 rules showing OK, confirming that Prometheus has loaded and is evaluating the Pgpool alert definitions every 30 seconds. (“OK” here means the rule expression evaluates without error — it’s independent of whether the alert condition itself is currently true; see the next section.)
Verify End-to-End
1. Check the metrics endpoint
$ curl -s 'http://localhost:9090/api/v1/query?query=pgpool2_up%7Bnamespace%3D%22alert-pgpool%22%7D' | jq .
{
  "status": "success",
  "data": {
    "resultType": "vector",
    "result": [
      {
        "metric": {
          "__name__": "pgpool2_up",
          "container": "exporter",
          "job": "pgpool-alert-stats",
          "namespace": "alert-pgpool",
          "pod": "pgpool-alert-0"
        },
        "value": [1784194103.883, "1"]
      }
    ]
  }
}
pgpool2_up reads 1, confirming the exporter is successfully querying Pgpool.
2. Check the Prometheus target is UP
Prometheus discovers more than 20 scrape pools on a shared cluster, so instead of the Target health page, query up directly for a reliable view.
Open http://localhost:9090/query?g0.expr=up%7Bnamespace%3D%22alert-pgpool%22%7D&g0.tab=1.
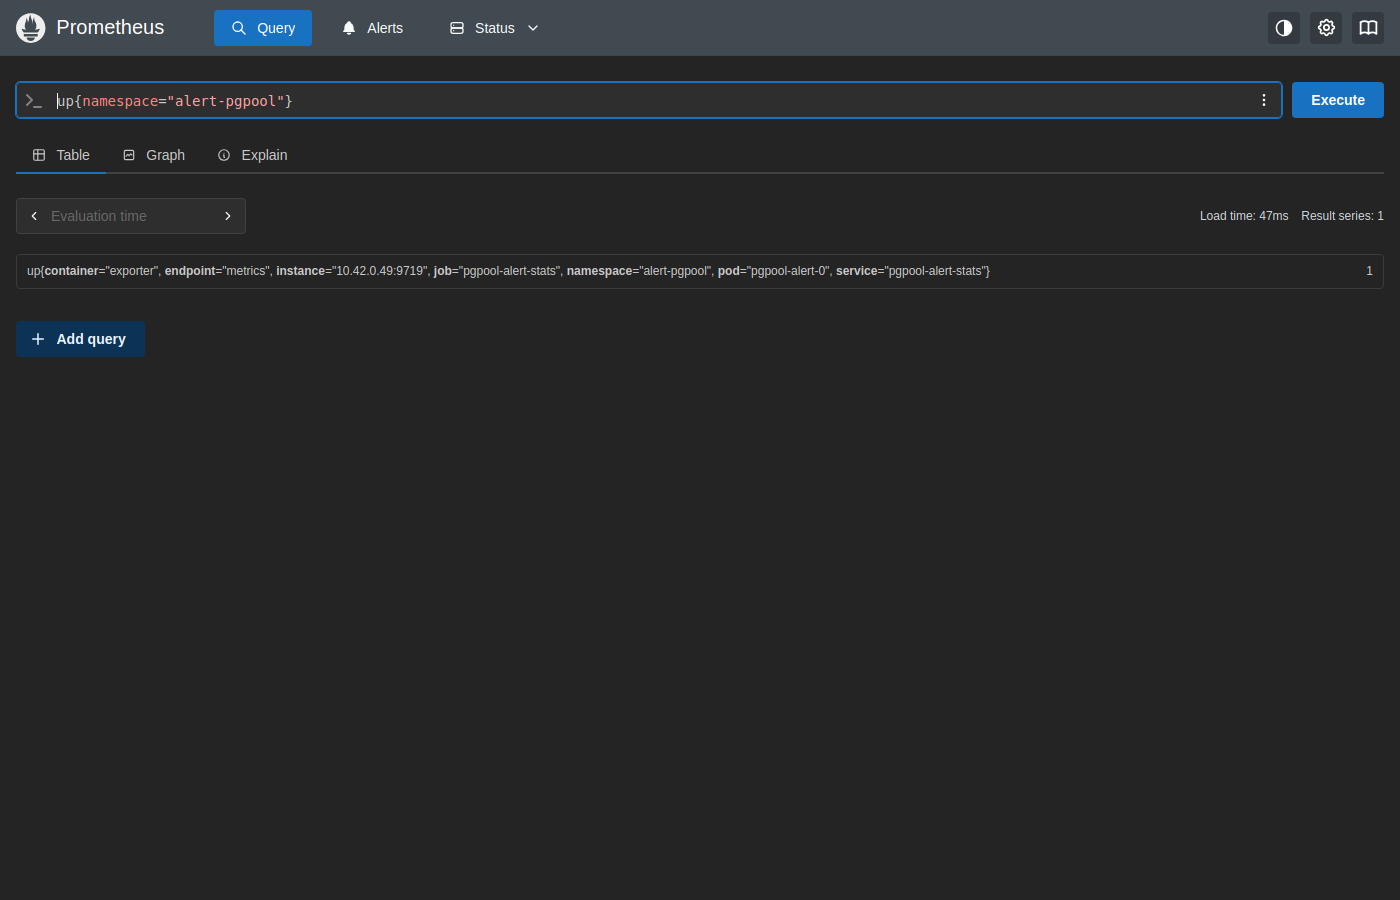
The pgpool-alert-0 pod reports up == 1 via the pgpool-alert-stats service/job, confirming Prometheus is scraping it successfully.
3. Confirm the Pgpool alerts
Open http://localhost:9090/alerts.
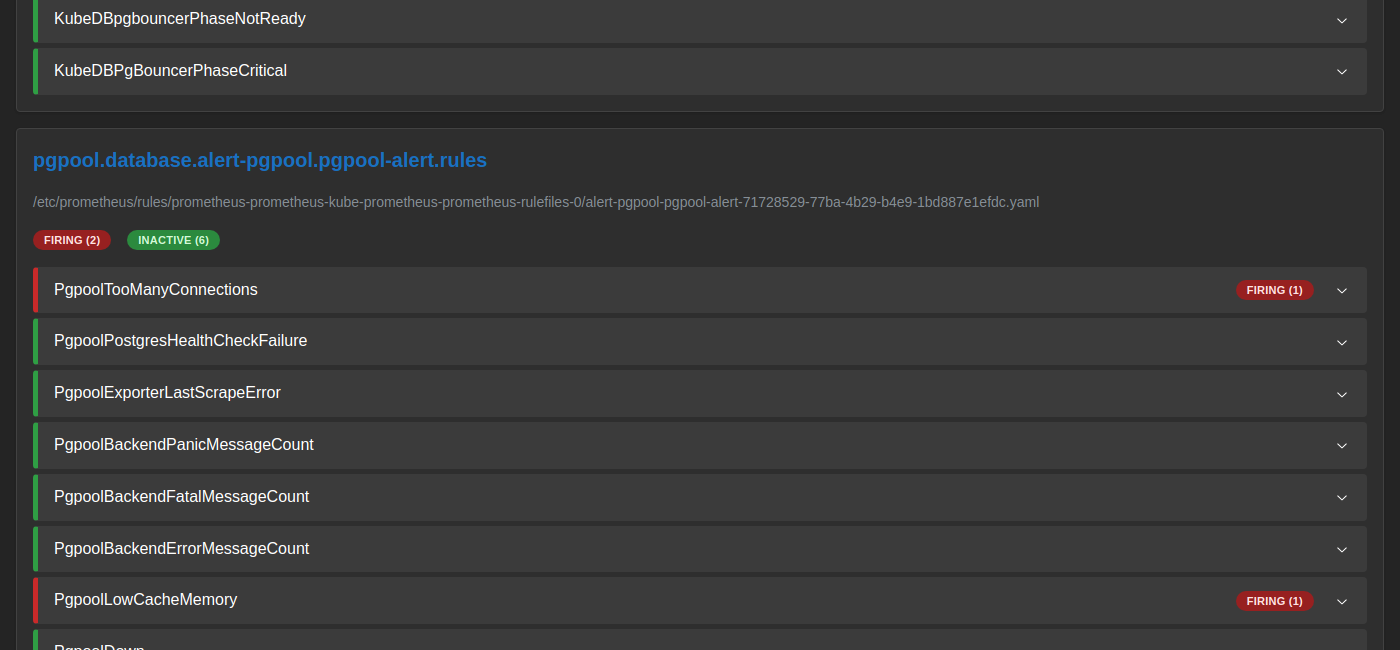
6 of the 8 database-group rules show INACTIVE as expected, but PgpoolTooManyConnections and PgpoolLowCacheMemory are FIRING even on this freshly-deployed, idle instance — both are chart/threshold gaps, not real problems:
PgpoolTooManyConnections(pgpool2_backend_by_process_total / pgpool2_backend_total > 0.1) does not measure actual client-connection load at all.pgpool2_backend_by_process_totalreads one child process’s configuredmax_pool, andpgpool2_backend_by_process_total’s ratio to the fleet-wide total collapses to1 / num_init_children— a constant determined purely by config, not usage. Withnum_init_children=5(the webhook-enforced minimum from the note above), that ratio is a fixed20%, permanently over the chart’s default10%threshold. Onlynum_init_children >= 11would bring the ratio under 10%, which in turn requires raising the backend’smax_connectionswell past 200 to satisfy the other webhook check.PgpoolLowCacheMemory(pgpool2_pool_cache_free_cache_entries_size / 1000000 < 100) fires because Pgpool’s in-memory query cache (memory_cache_enabled) is off by default — the metric simply reads0when the cache is disabled, which is always< 100. This alert is only meaningful oncememory_cache_enabled=onis explicitly configured.
Both are documented in the Alert Reference below; disable or raise their thresholds if you don’t intend to run with a large num_init_children or the in-memory cache enabled.
4. Check AlertManager
Port-forward AlertManager to view currently firing alerts.
$ kubectl port-forward -n monitoring \
    svc/prometheus-kube-prometheus-alertmanager 9093:9093
Open http://localhost:9093.
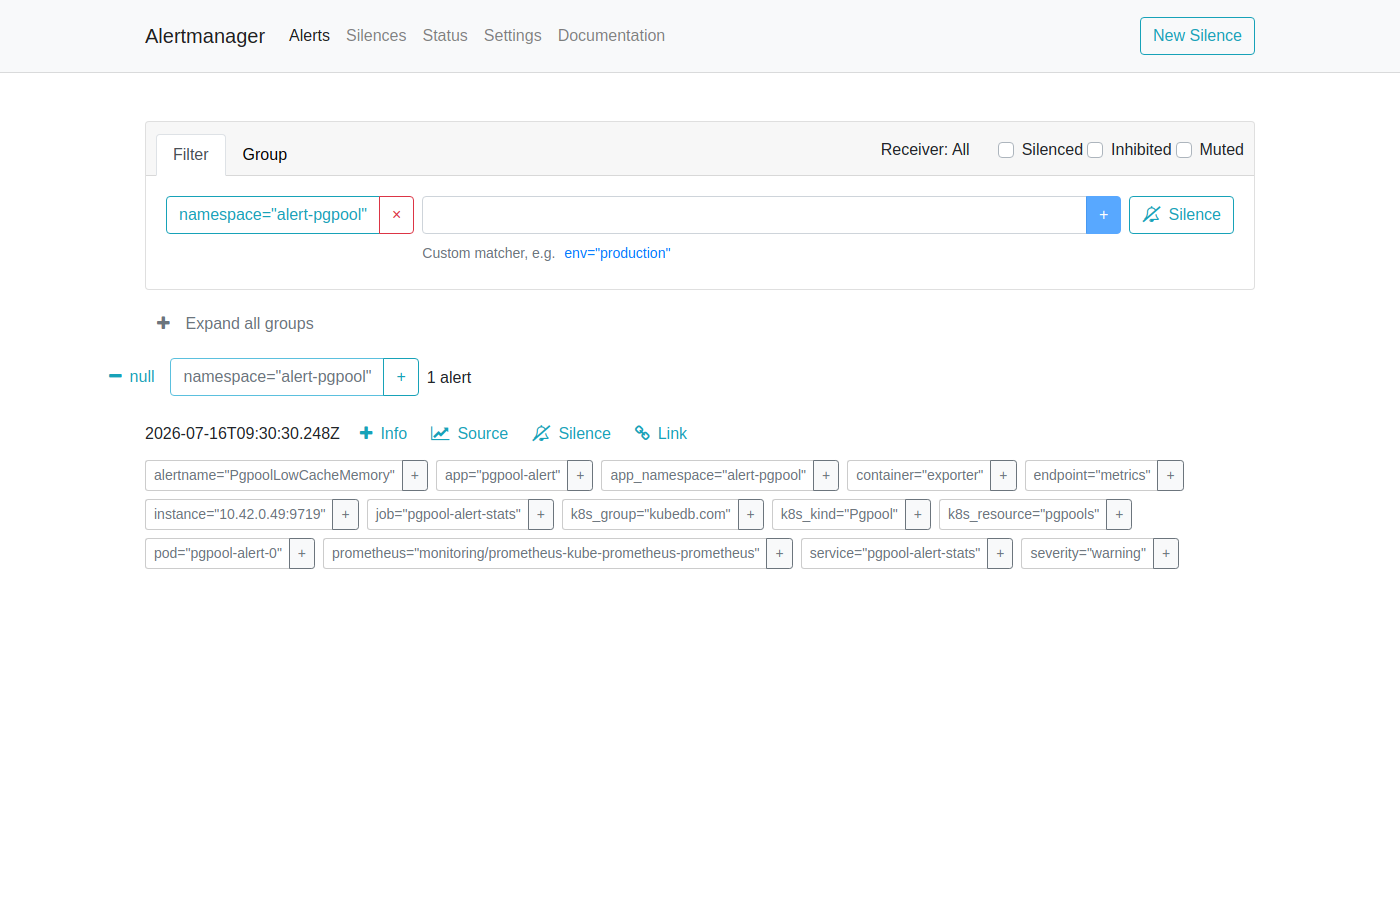
Matches the previous step — PgpoolLowCacheMemory (and, depending on scrape timing, PgpoolTooManyConnections) is visible here for the reasons explained above, not because anything is actually broken.
5. Grafana dashboard
Grafana dashboards for Pgpool are documented separately rather than duplicated in this alerting guide — see Grafana Dashboard for how to provision and explore the Pgpool dashboards (via the kubedb-grafana-dashboards chart, --set featureGates.Pgpool=true).
Simulating a Firing Alert
This section deliberately breaks the PostgreSQL backend so you can observe PgpoolDown transition from INACTIVE to FIRING, through to the AlertManager dashboard, and then resolve it.
Why the backend, not Pgpool itself: Pgpool’s own worker processes are supervised and respawn essentially instantly after a
kill, so a simple repeated-kill loop against thepgpoolcontainer never leaves a large enough gap for Prometheus to observe an outage. Freezing every Pgpool process withkill -STOPalso doesn’t produce a clean “down” signal — the exporter’s own query to Pgpool just hangs, so the whole scrape times out (up=0, no app metrics at all) rather than reportingpgpool2_up=0. Crashing the backend Postgres instead reliably drivespgpool2_upto0, because the exporter can still reach Pgpool itself; Pgpool just fails to service the exporter’s probe query against a dead backend.
Container caveat: the
postgrescontainer’sPID 1istini, which does not notice if thepostgresserver process underneath it dies —kubectl get podskeeps reporting1/1 Runningeven though the database is gone for good. Recovery requires deleting the pod (see Step 4), not just waiting.
1. Crash the PostgreSQL backend
$ kubectl exec -n alert-pgpool pg-backend-alert-0 -- sh -c '
    end=$(( $(date +%s) + 60 ));
    while [ $(date +%s) -lt $end ]; do
      pid=$(pgrep -x postgres | head -1);
      [ -n "$pid" ] && kill -9 "$pid" 2>/dev/null;
      sleep 1;
    done'
A single kill -9 on the postmaster is enough to bring the backend down permanently in this image — the wrapper script does not restart it. The loop above just ensures the very first attempt lands.
2. Watch the alert fire in Prometheus
Open http://localhost:9090/alerts.
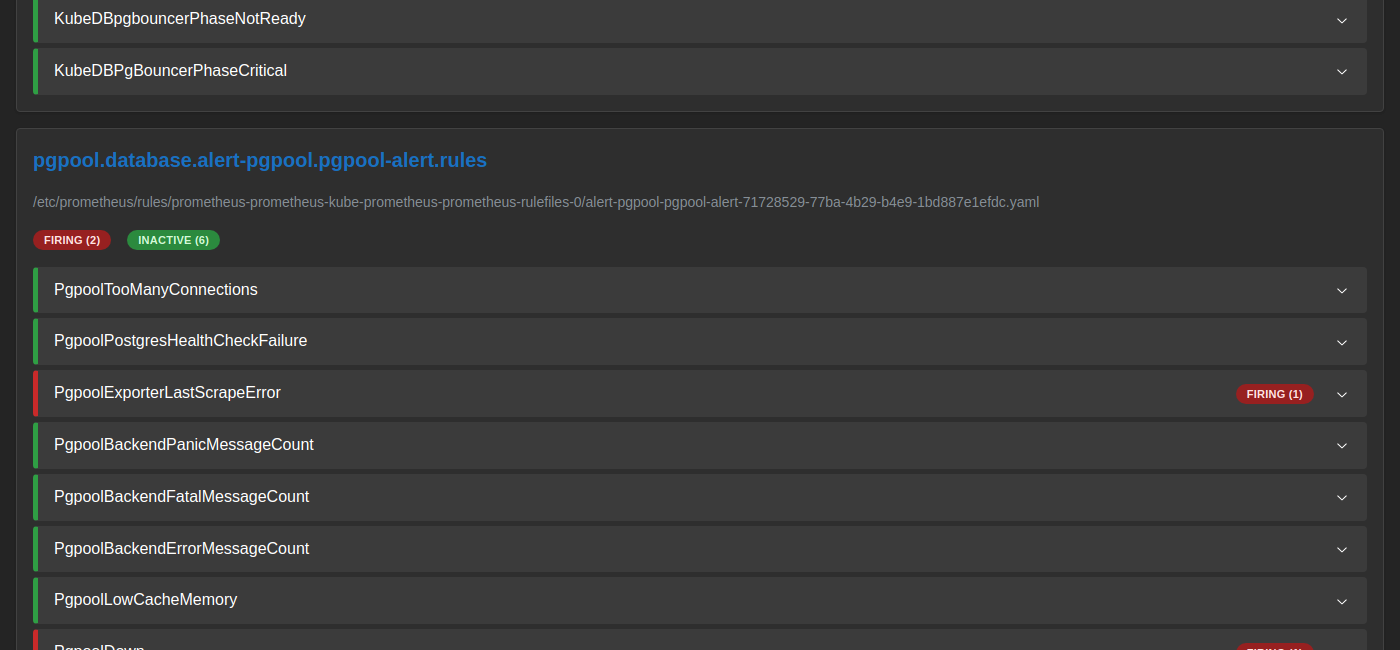
PgpoolDown (pgpool2_up == 0, for: 0m) transitions to FIRING as soon as the exporter’s probe query against the dead backend fails. PgpoolExporterLastScrapeError fires alongside it for the same reason.
3. Check the AlertManager dashboard
Open http://localhost:9093.
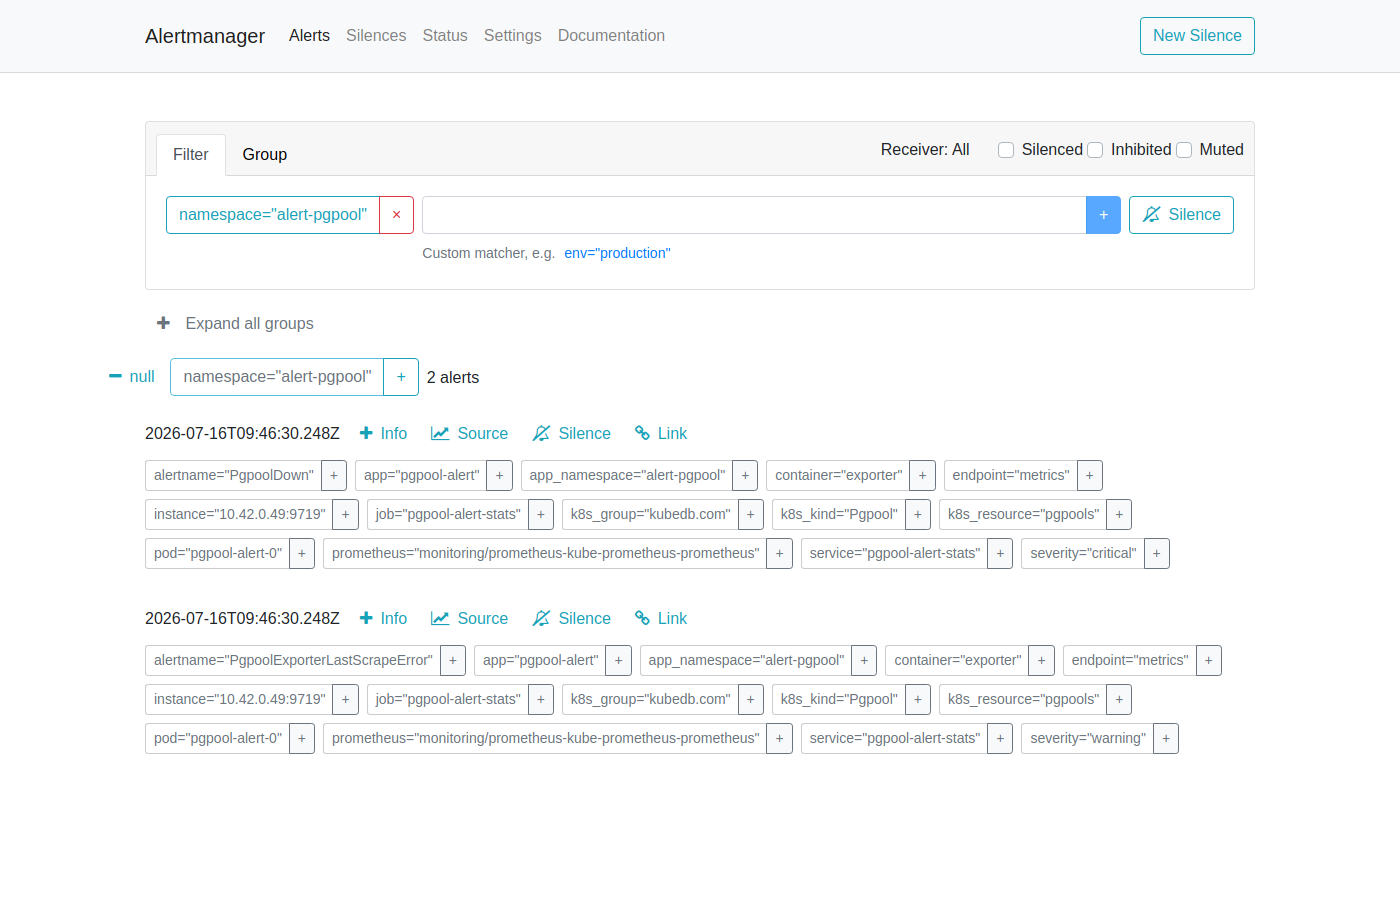
AlertManager shows the PgpoolDown alert. The alert card displays:
- Severity:
critical - pgpool:
pgpool-alertin thealert-pgpoolnamespace - Started: timestamp when the alert first fired
AlertManager routes this alert to every receiver configured in your alertmanagerConfig (Slack, email, PagerDuty, webhook, etc.) based on your routing tree. If no receiver is configured, the alert is visible here but silently dropped.
4. Restore the PostgreSQL backend
Because of the tini/dead-postmaster caveat above, the pod will not recover on its own — delete it to force the PetSet to recreate it cleanly.
$ kubectl delete pod -n alert-pgpool pg-backend-alert-0
pod "pg-backend-alert-0" deleted

$ kubectl get postgres -n alert-pgpool pg-backend-alert -w
NAME               VERSION   STATUS   AGE
pg-backend-alert   16.13     Ready    40m
Once both the Postgres backend and Pgpool report Ready, Prometheus marks PgpoolDown INACTIVE again and AlertManager sends a resolved notification to all receivers.
Alert Reference
All alerts are scoped to the pgpool-alert instance in the alert-pgpool namespace via the PromQL label filters job="pgpool-alert-stats" / namespace="alert-pgpool" (database group), or app="pgpool-alert" / namespace="alert-pgpool" (provisioner group).
Database Group
Fired based on live metrics from the pgpool2_exporter sidecar.
| Alert | Severity | For | What It Means |
|---|---|---|---|
PgpoolTooManyConnections | warning | 1m | Fires by design at the webhook-minimum pool config — see the explanation above. Not usage-based; only meaningful once num_init_children is raised well above the minimum. |
PgpoolPostgresHealthCheckFailure | critical | instant | More than 10 recorded health-check failures against the backend Postgres. |
PgpoolExporterLastScrapeError | warning | instant | The exporter’s last scrape/probe against Pgpool failed. |
PgpoolBackendPanicMessageCount | critical | instant | More than 10 PANIC-level messages returned from the backend. |
PgpoolBackendFatalMessageCount | critical | instant | More than 10 FATAL-level messages returned from the backend. |
PgpoolBackendErrorMessageCount | critical | instant | More than 10 ERROR-level messages returned from the backend. |
PgpoolLowCacheMemory | warning | 1m | Fires by design when memory_cache_enabled is off (the default) — see the explanation above. |
PgpoolDown | critical | instant | pgpool2_up == 0 — the exporter’s probe query against Pgpool failed, typically because the backend Postgres is unreachable. |
Provisioner Group
Monitors the KubeDB operator’s view of the Pgpool resource phase (sourced from Panopticon, not the Pgpool metrics endpoint).
| Alert | Severity | For | What It Means |
|---|---|---|---|
KubeDBPgpoolPhaseNotReady | critical | 1m | KubeDB marked the Pgpool resource NotReady. |
KubeDBPgpoolPhaseCritical | warning | 15m | Pgpool is degraded but not fully unavailable. |
Customising Alerts
To override thresholds or disable specific alert groups, create a custom values file and upgrade the chart.
# custom-alerts.yaml
form:
  alert:
    labels:
      release: prometheus
    groups:
      database:
        enabled: warning
        rules:
          pgpoolLowCacheMemory:
            enabled: false   # disable, since memory_cache is off in this setup
          pgpoolTooManyConnections:
            enabled: true
            duration: "5m"
            val: 0.5          # only fire above 50%, since the ratio is config-derived here
            severity: warning
      provisioner:
        enabled: "none"    # disable all provisioner alerts
$ helm upgrade pgpool-alert oci://ghcr.io/appscode-charts/pgpool-alerts \
    -n alert-pgpool \
    --version=v2026.7.14 \
    -f custom-alerts.yaml
Cleaning up
To remove all resources created in this tutorial, run the following commands.
# Remove the pgpool-alerts release (PrometheusRule)
$ helm uninstall pgpool-alert -n alert-pgpool

# Remove the Pgpool instance
$ kubectl delete pgpool -n alert-pgpool pgpool-alert

# Remove the PostgreSQL backend
$ kubectl delete postgres -n alert-pgpool pg-backend-alert

# Delete namespace
$ kubectl delete ns alert-pgpool
Next Steps
- Monitor your Pgpool instance with KubeDB using built-in Prometheus.
- Monitor your Pgpool instance with KubeDB using Prometheus operator.
- Want to hack on KubeDB? Check our contribution guidelines.