







































New to KubeDB? Please start here.
PgBouncer Alerting with Prometheus
This tutorial shows you how to configure Prometheus-based alerting for a KubeDB-managed PgBouncer instance using the pgbouncer-alerts Helm chart.
Before You Begin
Ensure you have a Kubernetes cluster and that
kubectlis configured to communicate with it. If you do not already have a cluster, you can create one using kind.Install the KubeDB operator by following the steps here.
Deploy the database in the
alert-pgbouncernamespace:$ kubectl create ns alert-pgbouncer namespace/alert-pgbouncer createdBefore proceeding, complete the Configuration steps to deploy kube-prometheus-stack and Panopticon.
This tutorial assumes you already have a kube-prometheus-stack running in your cluster, with
Prometheusconfigured so that bothserviceMonitorSelectorandruleSelectormatch the labelrelease: prometheus.To verify the selectors:
$ kubectl get prometheus -n monitoring -o jsonpath='{.items[0].spec.ruleSelector}'
{"matchLabels":{"release":"prometheus"}}

$ kubectl get prometheus -n monitoring -o jsonpath='{.items[0].spec.serviceMonitorSelector}'
{"matchLabels":{"release":"prometheus"}}
To learn more about how Prometheus monitoring works with KubeDB, see the overview here.
PgBouncer is a connection pooler in front of a PostgreSQL backend, so this tutorial first deploys a single-node PostgreSQL instance, then a PgBouncer instance pointed at it. Both objects are deployed with monitoring enabled.
Note: YAML files used in this tutorial are stored in docs/examples/pgbouncer folder in GitHub repository kubedb/docs.
Overview
- KubeDB deploys PgBouncer with a dedicated
pgbouncer_exportersidecar (container nameexporter) that exposes metrics on port56790— PgBouncer itself has no built-in Prometheus endpoint, so every pod runs two containers:pgbouncerandexporter. - ServiceMonitor (named
{pgbouncer-name}-stats) is created automatically by KubeDB and tells Prometheus to scrape the exporter every 10 seconds. - PrometheusRule is created by the
pgbouncer-alertschart and contains PgBouncer alert definitions grouped by concern: database health and provisioner. - Prometheus Operator evaluates every rule expression every 30 seconds and fires matching alerts to AlertManager.
- AlertManager groups, inhibits, and silences alerts, then routes them to configured receivers (Slack, email, PagerDuty, webhook, etc.).
- Grafana dashboards for PgBouncer are covered separately — see Grafana Dashboard rather than duplicated here.
Deploy the PostgreSQL Backend
PgBouncer pools connections to a PostgreSQL instance, so deploy the backend first.
apiVersion: kubedb.com/v1
kind: Postgres
metadata:
  name: pg-backend-alert
  namespace: alert-pgbouncer
spec:
  version: "16.13"
  replicas: 1
  storageType: Durable
  storage:
    storageClassName: "local-path"
    accessModes:
      - ReadWriteOnce
    resources:
      requests:
        storage: 1Gi
  deletionPolicy: WipeOut
$ kubectl apply -f https://github.com/kubedb/docs/raw/v2026.6.19/docs/examples/pgbouncer/monitoring/pg-backend-alert.yaml
postgres.kubedb.com/pg-backend-alert created
Wait for the PostgreSQL instance to go into Ready state.
$ kubectl get postgres -n alert-pgbouncer pg-backend-alert
NAME               VERSION   STATUS   AGE
pg-backend-alert   16.13     Ready    3m
Deploy PgBouncer with Monitoring Enabled
Now deploy PgBouncer, pointing spec.database.databaseRef at the PostgreSQL instance above.
apiVersion: kubedb.com/v1
kind: PgBouncer
metadata:
  name: pgbouncer-alert
  namespace: alert-pgbouncer
spec:
  version: "1.23.1"
  replicas: 1
  database:
    syncUsers: true
    databaseName: "postgres"
    databaseRef:
      name: "pg-backend-alert"
      namespace: alert-pgbouncer
  connectionPool:
    maxClientConnections: 20
    reservePoolSize: 5
  deletionPolicy: WipeOut
  monitor:
    agent: prometheus.io/operator
    prometheus:
      serviceMonitor:
        labels:
          release: prometheus
        interval: 10s
Here,
spec.database.databaseReftells PgBouncer which KubeDB Postgres object to pool connections for, andspec.database.syncUsers: truekeeps PgBouncer’s user list in sync with the backend.spec.monitor.agent: prometheus.io/operatortells KubeDB to create aServiceMonitorresource managed by the Prometheus operator.spec.monitor.prometheus.serviceMonitor.labels.release: prometheusadds therelease: prometheuslabel to the createdServiceMonitor, matching the PrometheusserviceMonitorSelectorso the target is discovered automatically.
$ kubectl apply -f https://github.com/kubedb/docs/raw/v2026.6.19/docs/examples/pgbouncer/monitoring/pgbouncer-alert.yaml
pgbouncer.kubedb.com/pgbouncer-alert created
Now, wait for PgBouncer to go into Ready state.
$ kubectl get pgbouncer -n alert-pgbouncer pgbouncer-alert
NAME              VERSION   STATUS   AGE
pgbouncer-alert   1.23.1    Ready    40s
KubeDB creates a dedicated stats service with the -stats suffix for monitoring.
$ kubectl get svc -n alert-pgbouncer --selector="app.kubernetes.io/instance=pgbouncer-alert"
NAME                     TYPE        CLUSTER-IP      EXTERNAL-IP   PORT(S)     AGE
pgbouncer-alert          ClusterIP   10.43.40.193    <none>        5432/TCP    40s
pgbouncer-alert-pods     ClusterIP   None            <none>        5432/TCP    40s
pgbouncer-alert-stats    ClusterIP   10.43.148.12    <none>        56790/TCP   40s
KubeDB also creates a ServiceMonitor that tells Prometheus where to scrape.
$ kubectl get servicemonitor -n alert-pgbouncer
NAME                    AGE
pgbouncer-alert-stats   40s
Verify that the ServiceMonitor carries the release: prometheus label so Prometheus discovers it.
$ kubectl get servicemonitor -n alert-pgbouncer pgbouncer-alert-stats \
    -o jsonpath='{.metadata.labels.release}'
prometheus
Step 1 — Install pgbouncer-alerts
The pgbouncer-alerts chart creates a PrometheusRule resource containing PgBouncer alert definitions grouped by concern.
Why the Helm release name matters
The chart derives the PrometheusRule name and scopes every PromQL expression (via job="{release-name}-stats" / app="{release-name}") from the Helm release name — so the release name must match the PgBouncer object’s name (pgbouncer-alert) for the rules to be correctly scoped to this instance.
The chart’s default label is release: kube-prometheus-stack, so we must also override it at install time to match the Prometheus ruleSelector.
Install
$ helm upgrade -i pgbouncer-alert oci://ghcr.io/appscode-charts/pgbouncer-alerts \
    -n alert-pgbouncer \
    --create-namespace \
    --version=v2026.7.14 \
    --set form.alert.labels.release=prometheus
| Flag | Value | Purpose |
|---|---|---|
pgbouncer-alert (release name) | — | Scopes every PromQL expression to this instance (job="pgbouncer-alert-stats", app="pgbouncer-alert") |
-n alert-pgbouncer | alert-pgbouncer | Installs the PrometheusRule in the same namespace as the database |
form.alert.labels.release | prometheus | Matches the Prometheus ruleSelector so the rules are loaded |
Verify the PrometheusRule is created
$ kubectl get prometheusrule -n alert-pgbouncer
NAME              AGE
pgbouncer-alert   30s
Confirm the release: prometheus label is present.
$ kubectl get prometheusrule -n alert-pgbouncer pgbouncer-alert \
    -o jsonpath='{.metadata.labels.release}'
prometheus
Chart gap found: the chart’s
values.yamlalso declares anopsManageralert group (opsRequestFailed,opsRequestOnProgress,opsRequestStatusProgressingToLong), but only thedatabaseandprovisionergroups are actually rendered into the livePrometheusRuleat chart versionv2026.7.14— the same missing-group gap seen in several other*-alertscharts. Cross-checkhelm show valuesagainstkubectl get prometheusrule ... -o yamlrather than assuming every documented group is loaded.
Confirm Prometheus loaded the rules
Port-forward the Prometheus UI.
$ kubectl port-forward -n monitoring \
    svc/prometheus-kube-prometheus-prometheus 9090:9090
Open http://localhost:9090/rules and locate the pgbouncer.database and pgbouncer.provisioner groups.
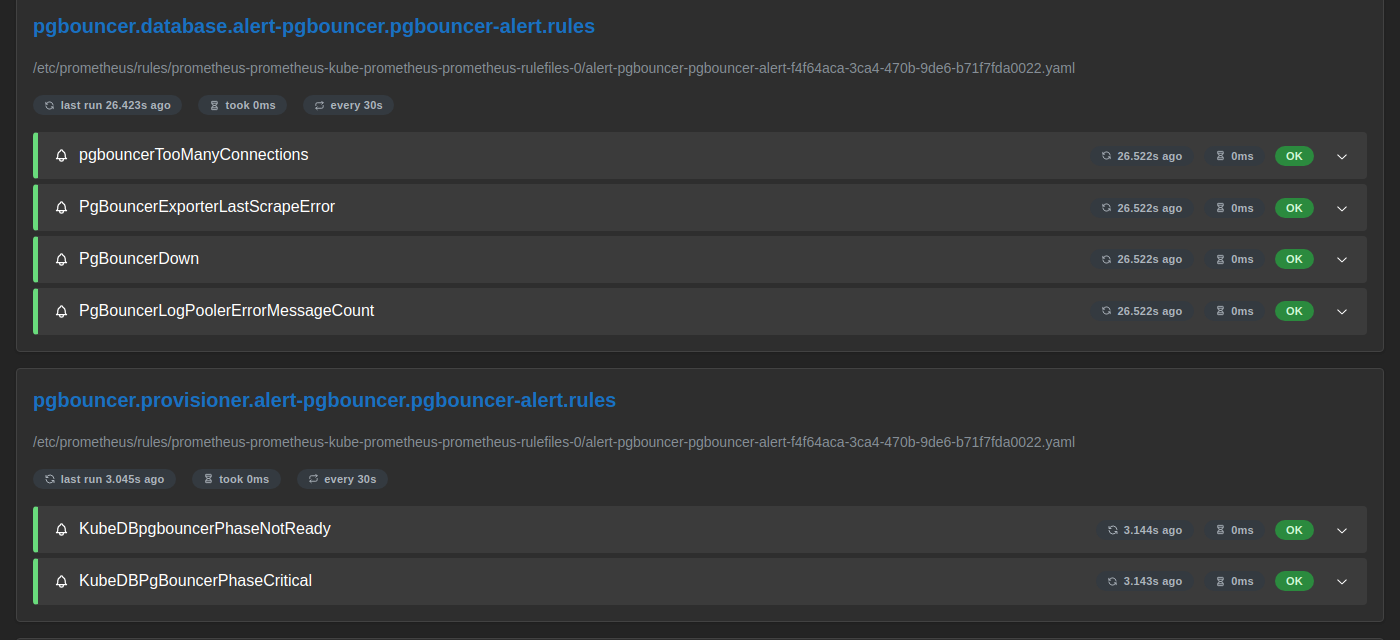
Both groups are visible with all 6 rules showing OK, confirming that Prometheus has loaded and is evaluating the PgBouncer alert definitions every 30 seconds.
Verify End-to-End
1. Check the metrics endpoint
The exporter sidecar container has no shell utilities (no wget/curl/ps), so rather than exec-ing into the pod, query the metric straight from Prometheus:
$ curl -s 'http://localhost:9090/api/v1/query?query=pgbouncer_up%7Bnamespace%3D%22alert-pgbouncer%22%7D' | jq .
{
  "status": "success",
  "data": {
    "resultType": "vector",
    "result": [
      {
        "metric": {
          "__name__": "pgbouncer_up",
          "container": "exporter",
          "job": "pgbouncer-alert-stats",
          "namespace": "alert-pgbouncer",
          "pod": "pgbouncer-alert-0"
        },
        "value": [1784192719.41, "1"]
      }
    ]
  }
}
pgbouncer_up reads 1, confirming the exporter is successfully scraping the PgBouncer process.
2. Check the Prometheus target is UP
Prometheus discovers more than 20 scrape pools on a shared cluster, so instead of the Target health page, query up directly for a reliable view.
Open http://localhost:9090/query?g0.expr=up%7Bnamespace%3D%22alert-pgbouncer%22%7D&g0.tab=1.
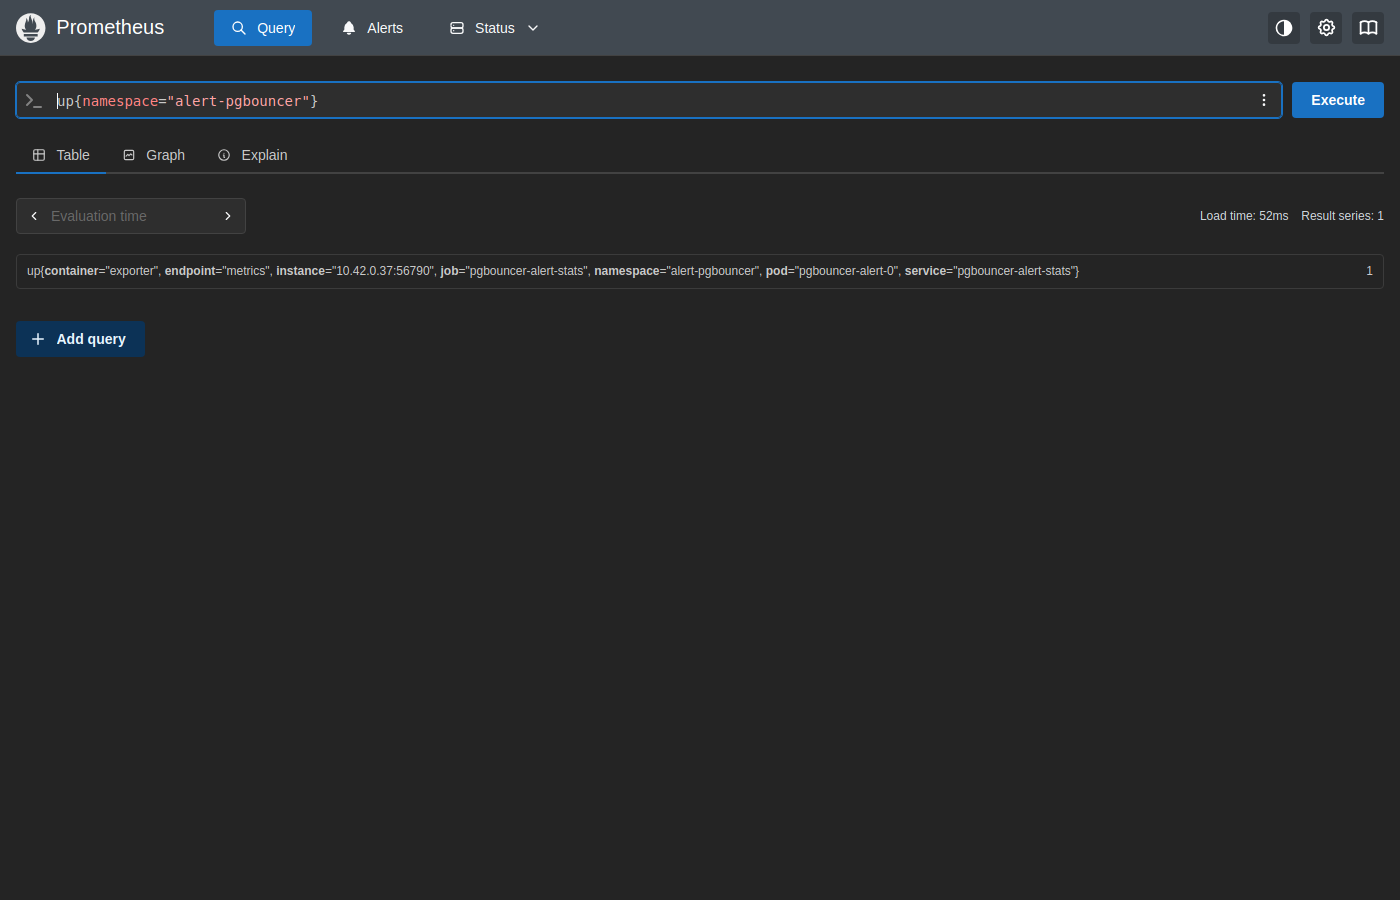
The pgbouncer-alert-0 pod reports up == 1 via the pgbouncer-alert-stats service/job, confirming Prometheus is scraping it successfully.
3. Confirm the PgBouncer alerts are inactive
Open http://localhost:9090/alerts.
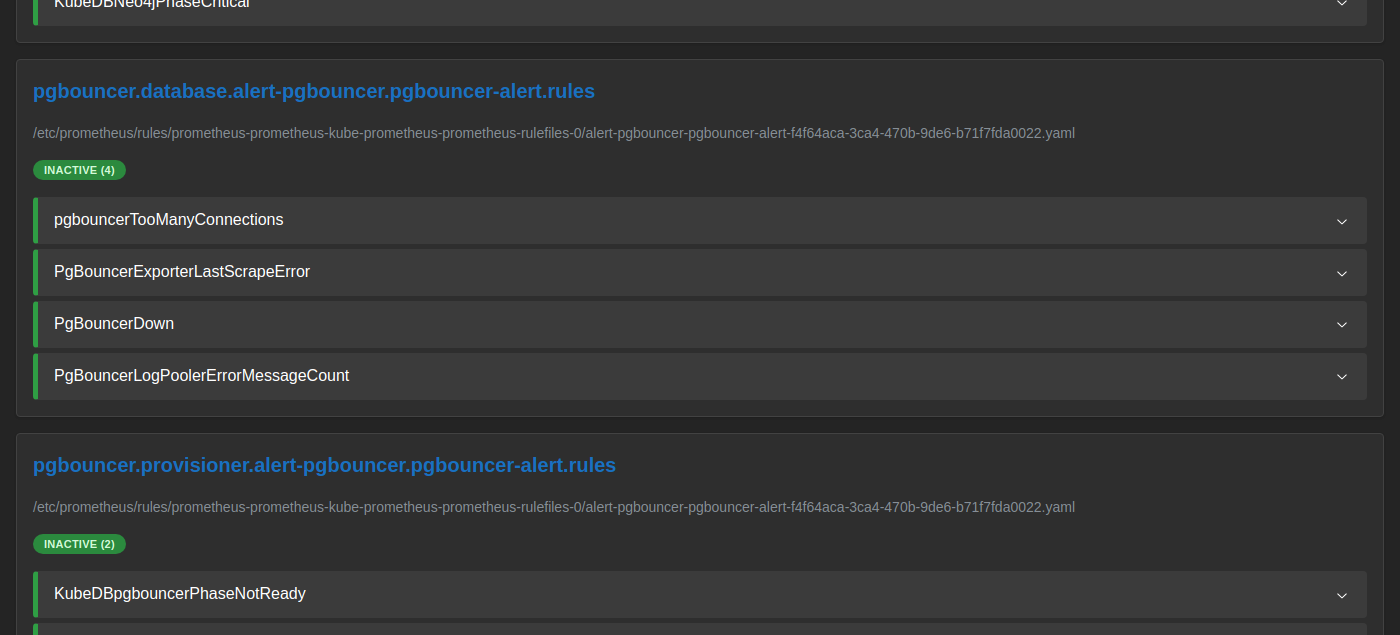
All rules across the pgbouncer.database and pgbouncer.provisioner groups show INACTIVE, confirming the instance is healthy and no alert thresholds are breached.
4. Check AlertManager
Port-forward AlertManager to view any currently firing alerts.
$ kubectl port-forward -n monitoring \
    svc/prometheus-kube-prometheus-alertmanager 9093:9093
Open http://localhost:9093.
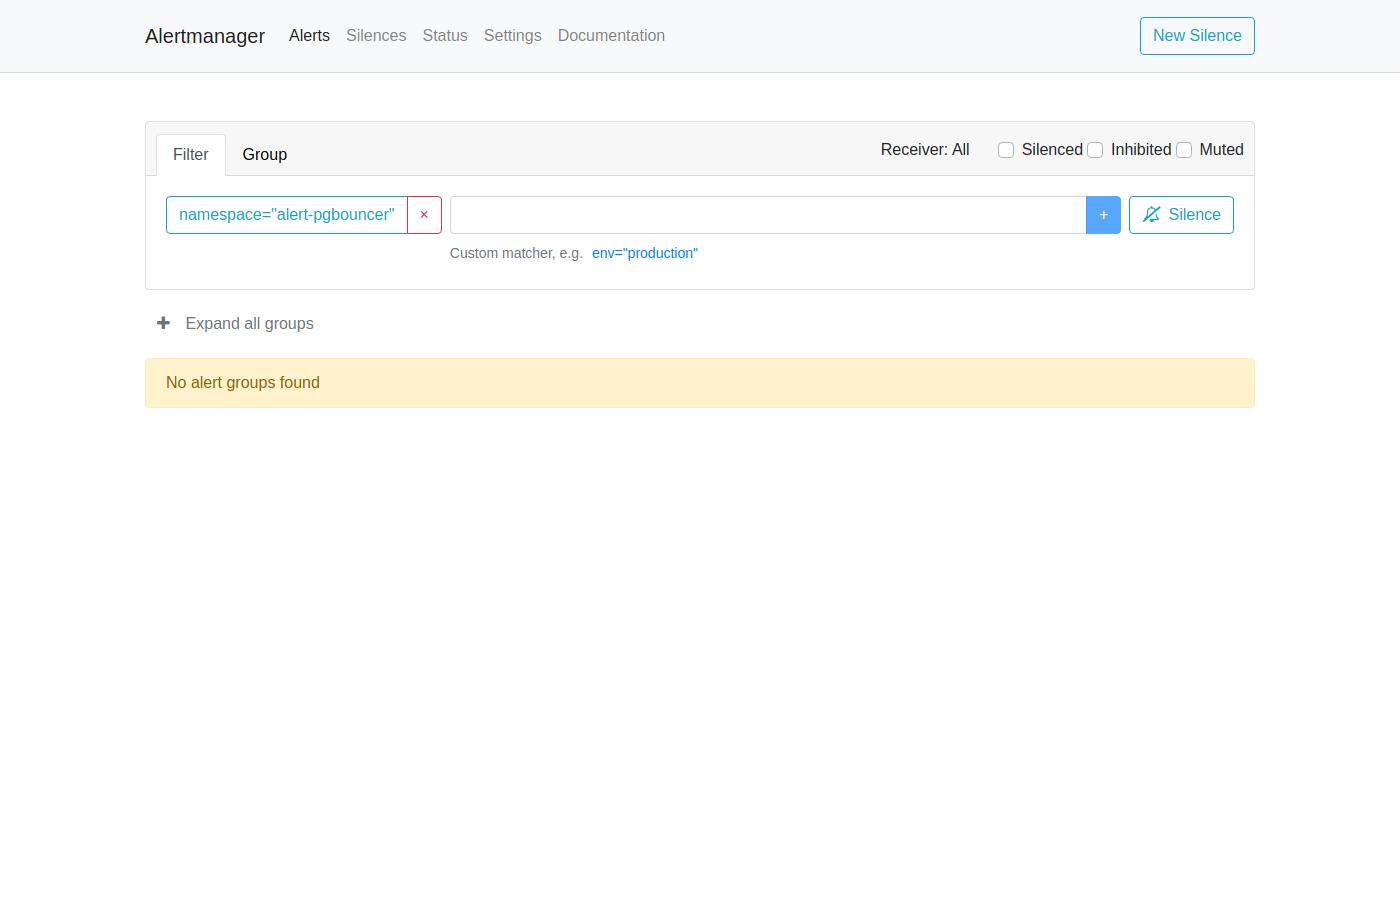
No alerts are firing for the alert-pgbouncer namespace.
5. Grafana dashboard
Grafana dashboards for PgBouncer are documented separately rather than duplicated in this alerting guide — see Grafana Dashboard for how to provision and explore the PgBouncer dashboards (via the kubedb-grafana-dashboards chart, --set featureGates.PgBouncer=true).
Simulating a Firing Alert
The previous section showed that all currently-loaded PgBouncer alerts are INACTIVE while the instance is healthy. This section deliberately triggers the KubeDBpgbouncerPhaseNotReady critical alert so you can observe the full alert lifecycle — from firing in Prometheus through to the AlertManager dashboard — and then resolve it.
Chart bug found:
PgBouncerDownis defined aspgbouncer_up{...} < 0. Sincepgbouncer_uponly ever reads0or1, this condition can never be true — the alert can never fire regardless of how long PgBouncer is down.KubeDBpgbouncerPhaseNotReady(provisioner group) is used below instead, since it correctly reflects PgBouncer being down via the KubeDB operator’s own phase tracking.
PgBouncer runs under a runit-style process supervisor inside its container (PID 1 is runsvdir, which watches the pgbouncer process via runsv and respawns it almost instantly after a kill). Killing it from outside the pod with repeated kubectl exec ... kill calls is not fast enough to out-pace the respawn — the network round-trip of each exec call is slower than runsv’s restart, so the process is back up before the next kill lands. Instead, run the crash loop inside the container with a single exec session so there is no round-trip delay between kills.
Also watch for: a plain
kill(SIGTERM) puts PgBouncer into a graceful shutdown (got SIGTERM, shutting down, waiting for all clients disconnect) that can hang indefinitely if no client ever disconnects — the process stays alive but stops accepting new connections, andrunsvwon’t respawn a process that hasn’t actually exited. Always usekill -9(SIGKILL) for this simulation so the crash is immediate and clean.
Because KubeDBpgbouncerPhaseNotReady requires the condition to persist for for: 1m, keep the process crashing for at least a couple of minutes so the KubeDB operator has time to mark the resource NotReady and hold it there past the one-minute window.
1. Crash the PgBouncer process repeatedly
$ kubectl exec -n alert-pgbouncer pgbouncer-alert-0 -c pgbouncer -- sh -c '
    end=$(( $(date +%s) + 150 ));
    while [ $(date +%s) -lt $end ]; do
      pkill -9 pgbouncer 2>/dev/null;
      sleep 0.2;
    done'
Let this run for a couple of minutes (it blocks in the foreground until the 150s window elapses — capture the screenshots below while it’s running), then let it finish or interrupt it once you’ve captured the firing state.
2. Watch the alert fire in Prometheus
Open http://localhost:9090/alerts.
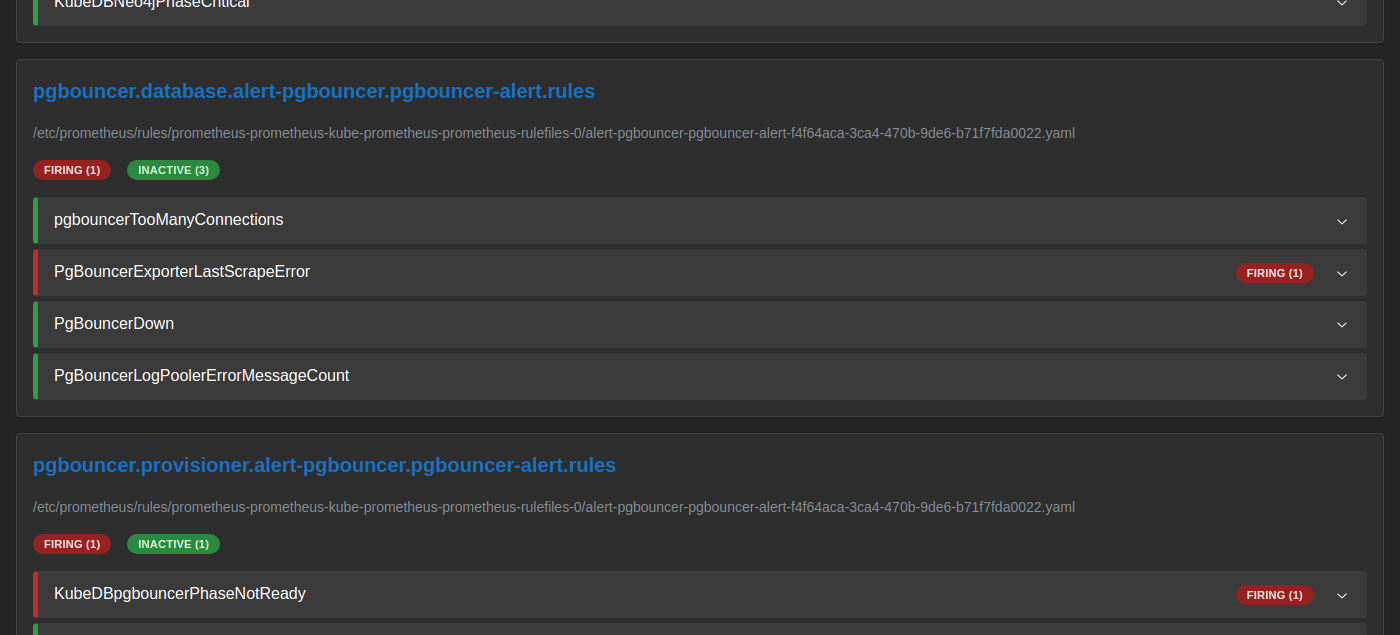
KubeDBpgbouncerPhaseNotReady transitions from INACTIVE to FIRING once kubedb_com_pgbouncer_status_phase{phase="NotReady"} has read 1 continuously for the full for: 1m duration — this metric comes from the KubeDB operator’s own view of the resource (exported via Panopticon), not from the PgBouncer metrics endpoint itself. Note that PgBouncerExporterLastScrapeError also fires as a side effect, since the exporter briefly fails to scrape a process that keeps getting killed mid-connection.
3. Check the AlertManager dashboard
Open http://localhost:9093.
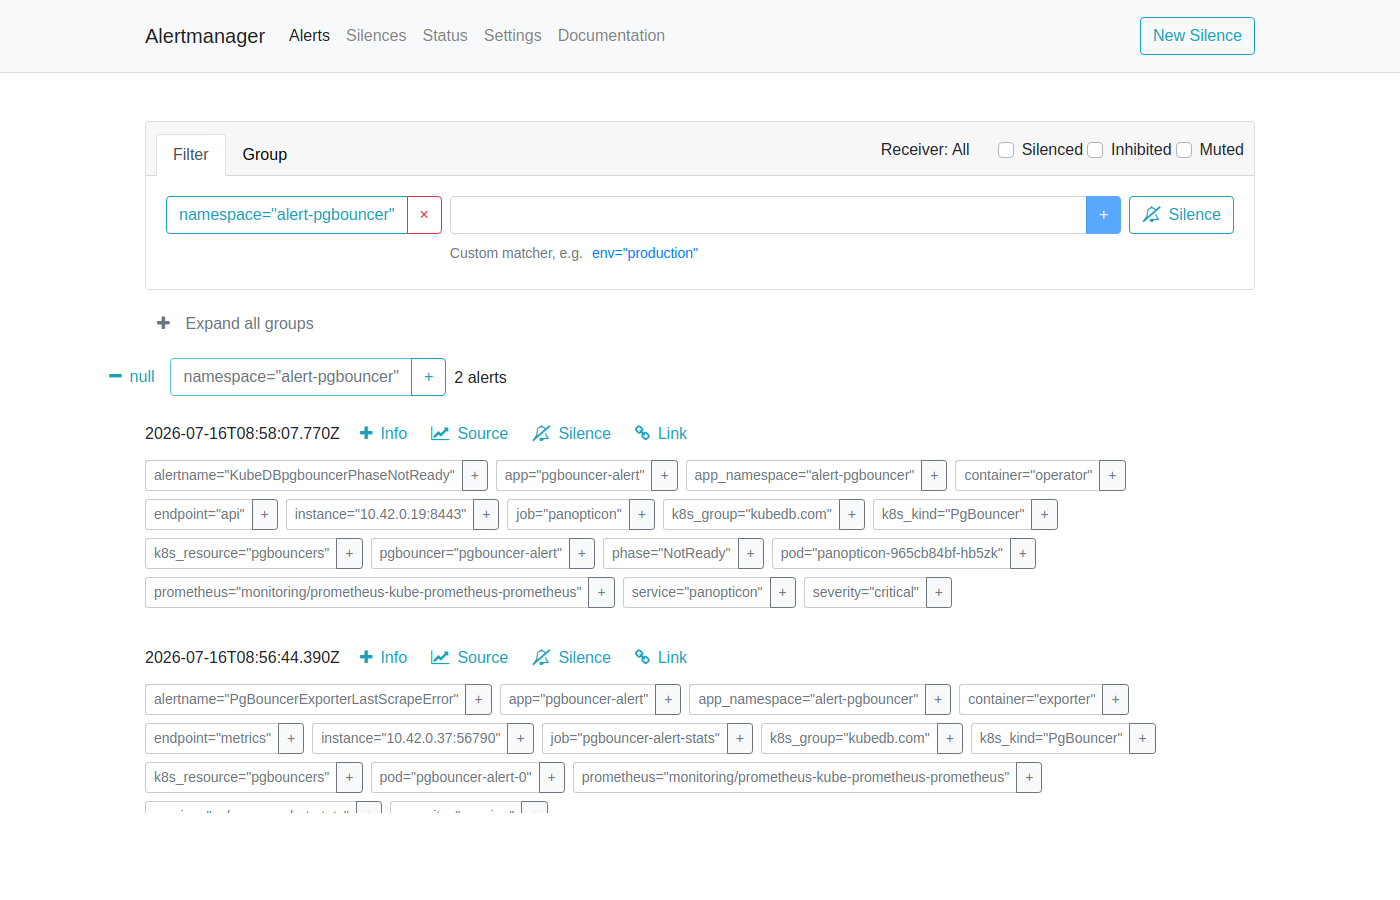
AlertManager shows the KubeDBpgbouncerPhaseNotReady alert. The alert card displays:
- Severity:
critical - pgbouncer:
pgbouncer-alertin thealert-pgbouncernamespace - phase:
NotReady - Started: timestamp when the alert first fired
AlertManager routes this alert to every receiver configured in your alertmanagerConfig (Slack, email, PagerDuty, webhook, etc.) based on your routing tree. If no receiver is configured, the alert is visible here but silently dropped.
4. Restore PgBouncer
Once the crash loop stops, runsv respawns the pgbouncer process and the KubeDB operator marks the resource Ready again within a few reconcile cycles.
$ kubectl get pgbouncer -n alert-pgbouncer pgbouncer-alert -w
NAME              VERSION   STATUS   AGE
pgbouncer-alert   1.23.1    Ready    24m
Note: if PgBouncer does not recover within a minute or two of stopping the loop (for example, if it was interrupted mid-shutdown rather than mid-crash), force a clean restart:
$ kubectl delete pod -n alert-pgbouncer pgbouncer-alert-0
pod "pgbouncer-alert-0" deleted
The PetSet controller recreates the pod immediately.
Once the phase returns to Ready, Prometheus marks the alert INACTIVE again and AlertManager sends a resolved notification to all receivers.
Alert Reference
All alerts are scoped to the pgbouncer-alert instance in the alert-pgbouncer namespace via the PromQL label filters job="pgbouncer-alert-stats" / namespace="alert-pgbouncer" (database group), or app="pgbouncer-alert" / namespace="alert-pgbouncer" (provisioner group).
Database Group
Fired based on live metrics from the pgbouncer_exporter sidecar.
| Alert | Severity | For | What It Means |
|---|---|---|---|
pgbouncerTooManyConnections | warning | 1m | Current connections exceed 70% of pgbouncer_databases_max_connections. |
PgBouncerExporterLastScrapeError | warning | instant | pgbouncer_last_scrape_error is non-zero — the exporter failed its last scrape of PgBouncer’s admin console. |
PgBouncerDown | critical | instant | Chart bug: expression is pgbouncer_up < 0, which can never be true since pgbouncer_up is only ever 0 or 1 — this alert never fires. Use KubeDBpgbouncerPhaseNotReady below to detect PgBouncer being down. |
PgBouncerLogPoolerErrorMessageCount | critical | instant | More than 10 pooler error messages logged from the Postgres backend. |
Provisioner Group
Monitors the KubeDB operator’s view of the PgBouncer resource phase (sourced from Panopticon, not the PgBouncer metrics endpoint).
| Alert | Severity | For | What It Means |
|---|---|---|---|
KubeDBpgbouncerPhaseNotReady | critical | 1m | KubeDB marked the PgBouncer resource NotReady — the pooler cannot reach/serve the backend. |
KubeDBPgBouncerPhaseCritical | warning | 15m | PgBouncer is degraded but not fully unavailable. |
Customising Alerts
To override thresholds or disable specific alert groups, create a custom values file and upgrade the chart.
# custom-alerts.yaml
form:
  alert:
    labels:
      release: prometheus
    groups:
      database:
        enabled: warning
        rules:
          pgbouncerTooManyConnections:
            enabled: true
            duration: "5m"
            val: 90        # fire at 90% instead of the default 70%
            severity: warning
      provisioner:
        enabled: "none"    # disable all provisioner alerts
$ helm upgrade pgbouncer-alert oci://ghcr.io/appscode-charts/pgbouncer-alerts \
    -n alert-pgbouncer \
    --version=v2026.7.14 \
    -f custom-alerts.yaml
Cleaning up
To remove all resources created in this tutorial, run the following commands.
# Remove the pgbouncer-alerts release (PrometheusRule)
$ helm uninstall pgbouncer-alert -n alert-pgbouncer

# Remove the PgBouncer instance
$ kubectl delete pgbouncer -n alert-pgbouncer pgbouncer-alert

# Remove the PostgreSQL backend
$ kubectl delete postgres -n alert-pgbouncer pg-backend-alert

# Delete namespace
$ kubectl delete ns alert-pgbouncer
Next Steps
- Monitor your PgBouncer instance with KubeDB using built-in Prometheus.
- Monitor your PgBouncer instance with KubeDB using Prometheus operator.
- Use private Docker registry to deploy PgBouncer with KubeDB.
- Want to hack on KubeDB? Check our contribution guidelines.