









































New to KubeDB? Please start here.
Elasticsearch Alerting with Prometheus
This tutorial shows you how to configure Prometheus-based alerting for a KubeDB-managed Elasticsearch instance using the elasticsearch-alerts Helm chart.
Before You Begin
Ensure you have a Kubernetes cluster and that
kubectlis configured to communicate with it. If you do not already have a cluster, you can create one using kind.Install the KubeDB operator by following the steps here.
Deploy the database in a dedicated namespace, so the alerting resources created in this tutorial stay isolated from other workloads:
$ kubectl create ns alert-elasticsearch
namespace/alert-elasticsearch created
This tutorial assumes you already have a kube-prometheus-stack running in your cluster, with
Prometheusconfigured so that bothserviceMonitorSelectorandruleSelectormatch the labelrelease: prometheus. See the Grafana Dashboard guide for how to deploy kube-prometheus-stack if you don’t have it yet.To verify the selectors:
$ kubectl get prometheus -n monitoring -o jsonpath='{.items[0].spec.ruleSelector}'
{"matchLabels":{"release":"prometheus"}}

$ kubectl get prometheus -n monitoring -o jsonpath='{.items[0].spec.serviceMonitorSelector}'
{"matchLabels":{"release":"prometheus"}}
To learn more about how Prometheus monitoring works with KubeDB, see the overview here.
For dashboards and visualisation, see Grafana Dashboard for Elasticsearch.
Note: YAML files used in this tutorial are stored in docs/examples/elasticsearch folder in GitHub repository kubedb/docs.
Overview
- KubeDB deploys Elasticsearch with a built-in elasticsearch_exporter sidecar that exposes metrics on port
56790. - ServiceMonitor (named
{elasticsearch-name}-stats) is created automatically by KubeDB and tells Prometheus to scrape the exporter every 10 seconds. - PrometheusRule is created by the
elasticsearch-alertschart and contains all Elasticsearch alert definitions grouped by concern: database health, provisioner, ops-manager, Stash backup/restore, and KubeStash backup/restore. - Prometheus Operator evaluates every rule expression every 30 seconds and fires matching alerts to AlertManager.
- AlertManager groups, inhibits, and silences alerts, then routes them to configured receivers (Slack, email, PagerDuty, webhook, etc.).
Unlike some KubeDB databases, Elasticsearch’s exporter does not publish a single boolean “is the database up” gauge. Instead, the chart watches the health signals a real Elasticsearch cluster actually exposes — JVM heap usage, filesystem usage on the data path, cluster health color (green/yellow/red), node/data-node counts, and shard state — and fires alerts when any of those cross a threshold.
Deploy Elasticsearch with Monitoring Enabled
At first, let’s deploy an Elasticsearch database with monitoring enabled. Below is the Elasticsearch object we are going to create.
apiVersion: kubedb.com/v1
kind: Elasticsearch
metadata:
  name: es-alert-demo
  namespace: alert-elasticsearch
spec:
  version: xpack-8.19.9
  deletionPolicy: WipeOut
  storage:
    storageClassName: "longhorn"
    accessModes:
    - ReadWriteOnce
    resources:
      requests:
        storage: 1Gi
  monitor:
    agent: prometheus.io/operator
    prometheus:
      serviceMonitor:
        labels:
          release: prometheus
        interval: 10s
Here,
spec.monitor.agent: prometheus.io/operatortells KubeDB to create aServiceMonitorresource managed by the Prometheus operator.spec.monitor.prometheus.serviceMonitor.labels.release: prometheusadds therelease: prometheuslabel to the createdServiceMonitor, matching the PrometheusserviceMonitorSelectorso the target is discovered automatically.spec.storage.storageClassName: "longhorn"— we use a real, quota-bound block-storage class here rather than ahostPath-backed one. Later in this tutorial we deliberately fill the data volume to demonstrate the disk-usage alert firing, and doing that safely requires a volume whose capacity is actually isolated to this Pod rather than shared with the underlying node’s disk. Use whichever storage class is available/default in your cluster (kubectl get storageclass).
Let’s create the Elasticsearch resource.
$ kubectl apply -f https://github.com/kubedb/docs/raw/v2026.6.19/docs/examples/elasticsearch/monitoring/es-alert-demo.yaml
elasticsearch.kubedb.com/es-alert-demo created
Now, wait for the database to go into Ready state.
$ kubectl get elasticsearch -n alert-elasticsearch es-alert-demo
NAME            VERSION        STATUS   AGE
es-alert-demo   xpack-8.19.9   Ready    2m12s
KubeDB creates a dedicated stats service with the -stats suffix for monitoring.
$ kubectl get svc -n alert-elasticsearch --selector="app.kubernetes.io/instance=es-alert-demo"
NAME                   TYPE        CLUSTER-IP      EXTERNAL-IP   PORT(S)     AGE
es-alert-demo          ClusterIP   10.43.247.174   <none>        9200/TCP    2m21s
es-alert-demo-master   ClusterIP   None            <none>        9300/TCP    2m21s
es-alert-demo-pods     ClusterIP   None            <none>        9200/TCP    2m21s
es-alert-demo-stats    ClusterIP   10.43.223.213   <none>        56790/TCP   2m16s
KubeDB also creates a ServiceMonitor that tells Prometheus where to scrape.
$ kubectl get servicemonitor -n alert-elasticsearch
NAME                  AGE
es-alert-demo-stats   2m16s
Verify that the ServiceMonitor carries the release: prometheus label so Prometheus discovers it.
$ kubectl get servicemonitor -n alert-elasticsearch es-alert-demo-stats \
    -o jsonpath='{.metadata.labels.release}'
prometheus
Step 1 — Install elasticsearch-alerts
The elasticsearch-alerts chart creates a PrometheusRule resource containing all Elasticsearch alert definitions grouped by concern: database health, provisioner, ops-manager, Stash, and KubeStash.
Why the Helm release name matters
The chart derives the PromQL job/instance scoping (and the PrometheusRule name) from the Helm release name, not from a values field — so the release name must match the Elasticsearch object’s name (es-alert-demo) for the rules to be correctly scoped to this instance.
The chart’s default label is release: kube-prometheus-stack, so we must also override it at install time to match the Prometheus ruleSelector.
A note on defaults vs. this single-node demo
A handful of the chart’s default database group rules are tuned for a production, multi-node Elasticsearch cluster and don’t make sense for our single-node demo instance out of the box:
elasticsearchHealthyNodes/elasticsearchHealthyDataNodesdefault toval: 3(fire if fewer than 3 nodes are up). Our demo only ever has 1 node, so we override both toval: 1.elasticsearchUnassignedShardsfires whenever any shard is unassigned. A single-node cluster can never assign a replica shard (there’s no second node to place it on), so this rule would fire permanently in a single-node topology — we disable it for this demo.diskUsageHigh/diskAlmostFullcompute PVC usage askubelet_volume_stats_used_bytes / (kubelet_volume_stats_used_bytes + kube_pod_spec_volumes_persistentvolumeclaims_info). The..._infoseries is a constant label metric (always1), not a byte count, so this expression evaluates to ~100% regardless of actual usage — a chart-level expression defect. We disable both and rely instead onelasticsearchDiskOutOfSpace/elasticsearchDiskSpaceLow, which are computed from the exporter’s own accurateelasticsearch_filesystem_data_available_bytes/elasticsearch_filesystem_data_size_bytesmetrics.
Install
$ helm upgrade -i es-alert-demo oci://ghcr.io/appscode-charts/elasticsearch-alerts \
    -n alert-elasticsearch \
    --create-namespace \
    --version=v2026.7.14 \
    --set form.alert.labels.release=prometheus \
    --set form.alert.groups.database.rules.elasticsearchHealthyNodes.val=1 \
    --set form.alert.groups.database.rules.elasticsearchHealthyDataNodes.val=1 \
    --set form.alert.groups.database.rules.elasticsearchUnassignedShards.enabled=false \
    --set form.alert.groups.database.rules.diskUsageHigh.enabled=false \
    --set form.alert.groups.database.rules.diskAlmostFull.enabled=false
| Flag | Value | Purpose |
|---|---|---|
es-alert-demo (release name) | — | Scopes every PromQL expression to this instance (job="es-alert-demo-stats") |
-n alert-elasticsearch | alert-elasticsearch | Installs the PrometheusRule in the same namespace as the database |
form.alert.labels.release | prometheus | Matches the Prometheus ruleSelector so the rules are loaded |
...elasticsearchHealthyNodes.val / ...elasticsearchHealthyDataNodes.val | 1 | Matches our single-node demo topology instead of the production default of 3 |
...elasticsearchUnassignedShards.enabled | false | Avoids a permanently-firing alert on a single-node cluster (see above) |
...diskUsageHigh.enabled / ...diskAlmostFull.enabled | false | Works around the PVC-usage expression defect described above |
If you’re running against a multi-node production cluster, skip the four threshold/disable overrides above and just install with the release name and label override.
Verify the PrometheusRule is created
$ kubectl get prometheusrule -n alert-elasticsearch
NAME            AGE
es-alert-demo   30s
Confirm the release: prometheus label is present.
$ kubectl get prometheusrule -n alert-elasticsearch es-alert-demo \
    -o jsonpath='{.metadata.labels.release}'
prometheus
Confirm Prometheus loaded the rules
Port-forward the Prometheus UI and open the Status → Rule health page.
$ kubectl port-forward -n monitoring \
    svc/prometheus-kube-prometheus-prometheus 9090:9090
Open http://localhost:9090/rules?search=elasticsearch.
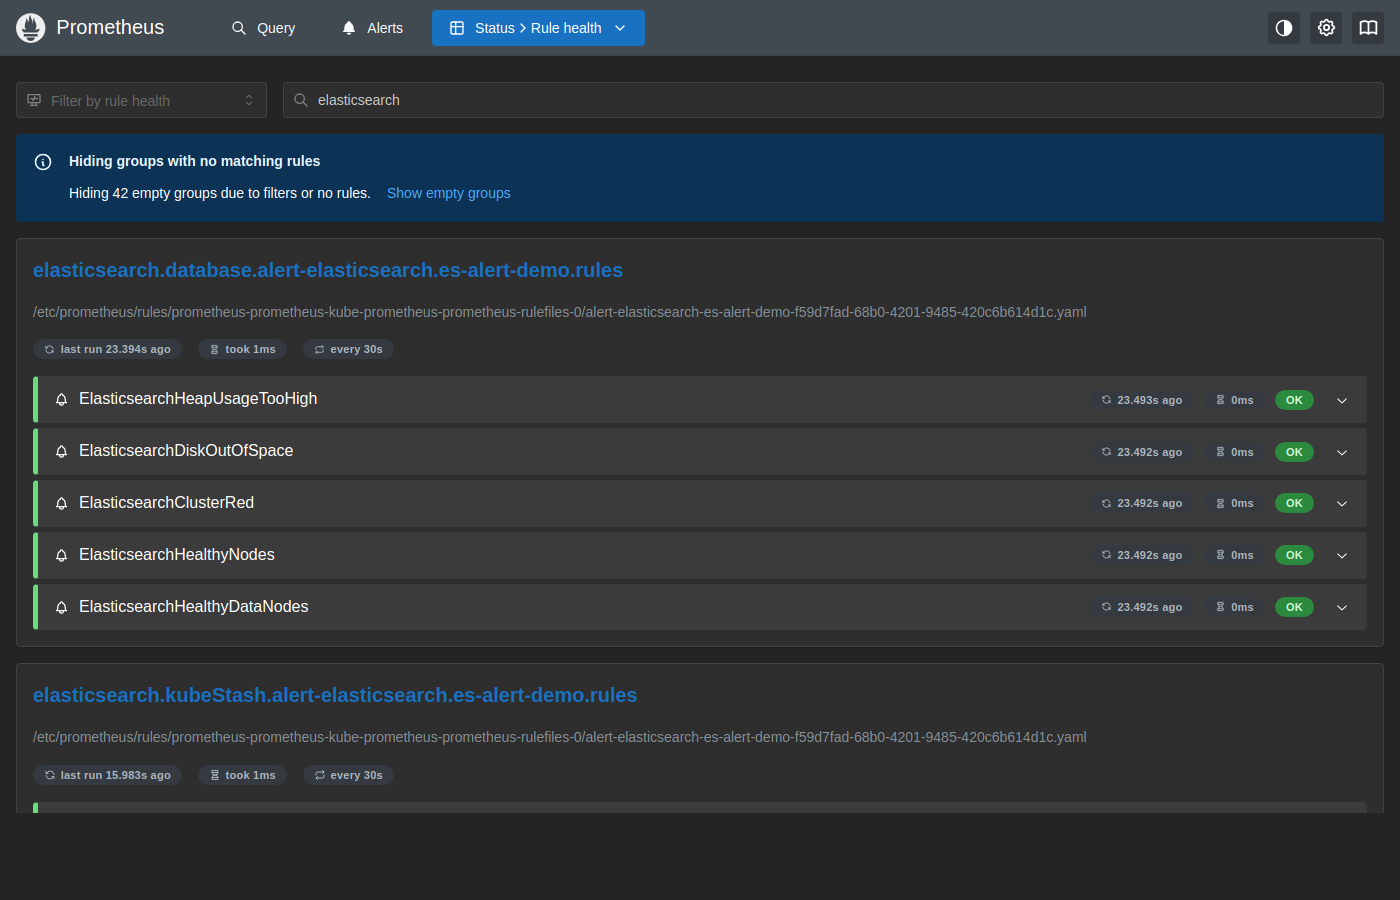
The elasticsearch.database.alert-elasticsearch.es-alert-demo.rules group is visible with all rules showing OK, confirming that Prometheus has loaded and is evaluating the Elasticsearch alert definitions every 30 seconds.
Verify End-to-End
1. Check the exporter is running
The exporter sidecar inside the Elasticsearch pod serves metrics at :56790/metrics. The elasticsearch_cluster_health_status series confirms the exporter can reach Elasticsearch and report cluster health.
$ kubectl exec -n alert-elasticsearch es-alert-demo-0 -c exporter -- \
    wget -qO- localhost:56790/metrics | grep elasticsearch_cluster_health_status
elasticsearch_cluster_health_status{cluster="es-alert-demo",color="green"} 0
elasticsearch_cluster_health_status{cluster="es-alert-demo",color="red"} 0
elasticsearch_cluster_health_status{cluster="es-alert-demo",color="yellow"} 1
A single-node Elasticsearch cluster reports yellow (not green) because it can never assign replica shards without a second node — this is expected and not an outage.
2. Check the Prometheus target is UP
Open http://localhost:9090/targets?search=es-alert-demo.
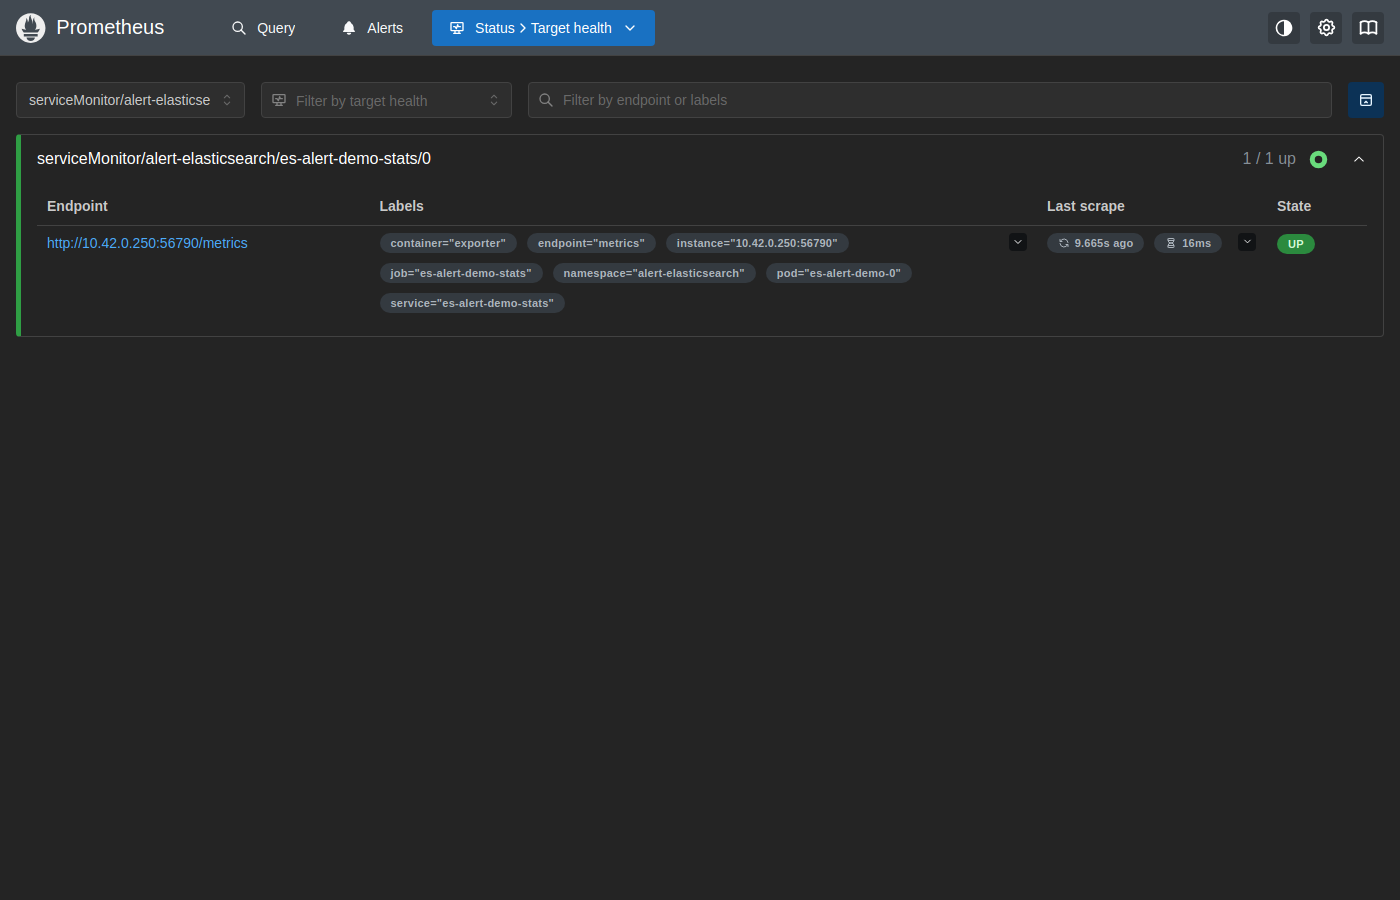
The target serviceMonitor/alert-elasticsearch/es-alert-demo-stats/0 shows UP, confirming metrics are being scraped from es-alert-demo-0 in the alert-elasticsearch namespace.
3. Confirm all Elasticsearch alerts are inactive
Open http://localhost:9090/alerts?search=elasticsearch to see the Elasticsearch alert groups.
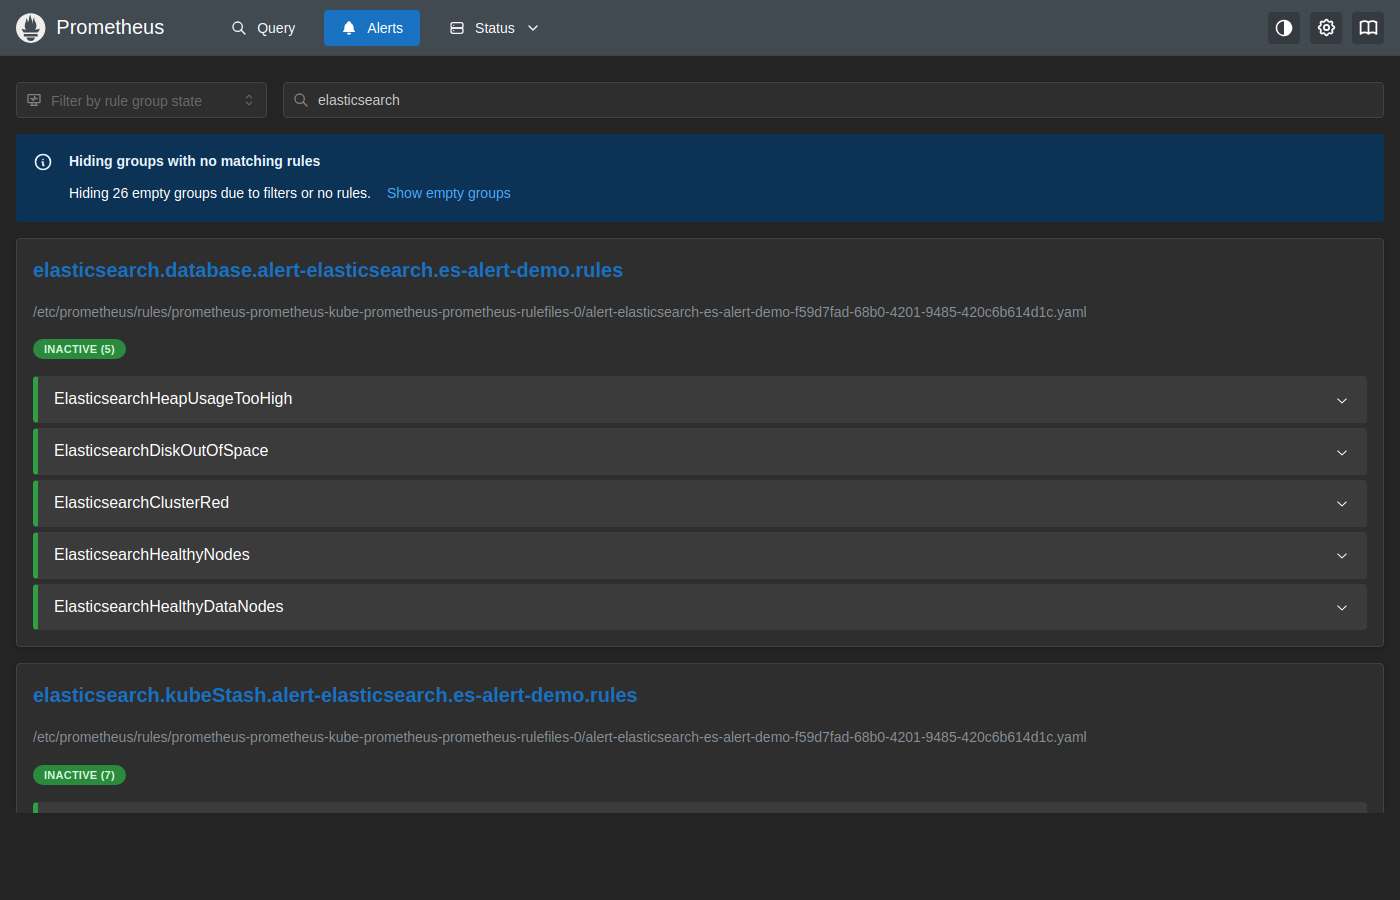
All 5 rules in the elasticsearch.database group show INACTIVE (5), meaning the database is healthy and no thresholds are breached.
4. Check AlertManager
Port-forward AlertManager to view any currently firing alerts.
$ kubectl port-forward -n monitoring \
    svc/prometheus-kube-prometheus-alertmanager 9093:9093
Open http://localhost:9093. With a healthy Elasticsearch instance, no alerts for es-alert-demo will be listed here.
Simulating a Firing Alert
The previous section confirmed that all alerts are INACTIVE while the database is healthy. This section walks through deliberately triggering the ElasticsearchDiskOutOfSpace critical alert so you can observe the full alert lifecycle — from firing in Prometheus through to the AlertManager dashboard — and then resolve it.
Elasticsearch doesn’t have a single “process down” style alert the way some other databases do — its exporter reports live cluster metrics rather than a boolean liveness gauge, and restarting the single node in this demo recovers in a few seconds, too fast to reliably observe in a scrape/evaluation cycle. Instead, we simulate a real resource-exhaustion scenario: filling the data volume, which is exactly the kind of incident this alert exists to catch.
1. Fill the data volume
The Elasticsearch container mounts its data directory from the 1Gi longhorn PVC we provisioned earlier. Write a padding file to push usage past the 90% critical threshold.
$ kubectl exec -n alert-elasticsearch es-alert-demo-0 -c elasticsearch -- \
    sh -c "df -h /usr/share/elasticsearch/data"
Filesystem                                              Size  Used Avail Use% Mounted on
/dev/longhorn/pvc-4f05381c-a1c8-49db-9e30-b5ea0007c77b  974M  896K  957M   1% /usr/share/elasticsearch/data

$ kubectl exec -n alert-elasticsearch es-alert-demo-0 -c elasticsearch -- \
    sh -c "mkdir -p /usr/share/elasticsearch/data/_disk_filler && \
           dd if=/dev/zero of=/usr/share/elasticsearch/data/_disk_filler/pad.bin bs=1M count=870"
870+0 records in
870+0 records out
912261120 bytes (912 MB, 870 MiB) copied, 11.1736 s, 81.6 MB/s

$ kubectl exec -n alert-elasticsearch es-alert-demo-0 -c elasticsearch -- \
    sh -c "df -h /usr/share/elasticsearch/data"
Filesystem                                              Size  Used Avail Use% Mounted on
/dev/longhorn/pvc-4f05381c-a1c8-49db-9e30-b5ea0007c77b  974M  871M   87M  91% /usr/share/elasticsearch/data
Wait 30–60 seconds for the next Prometheus scrape cycle (configured at 10 s) and rule-evaluation cycle (30 s) to register the new disk usage.
2. Watch the alert fire in Prometheus
Open http://localhost:9090/alerts?search=elasticsearch.
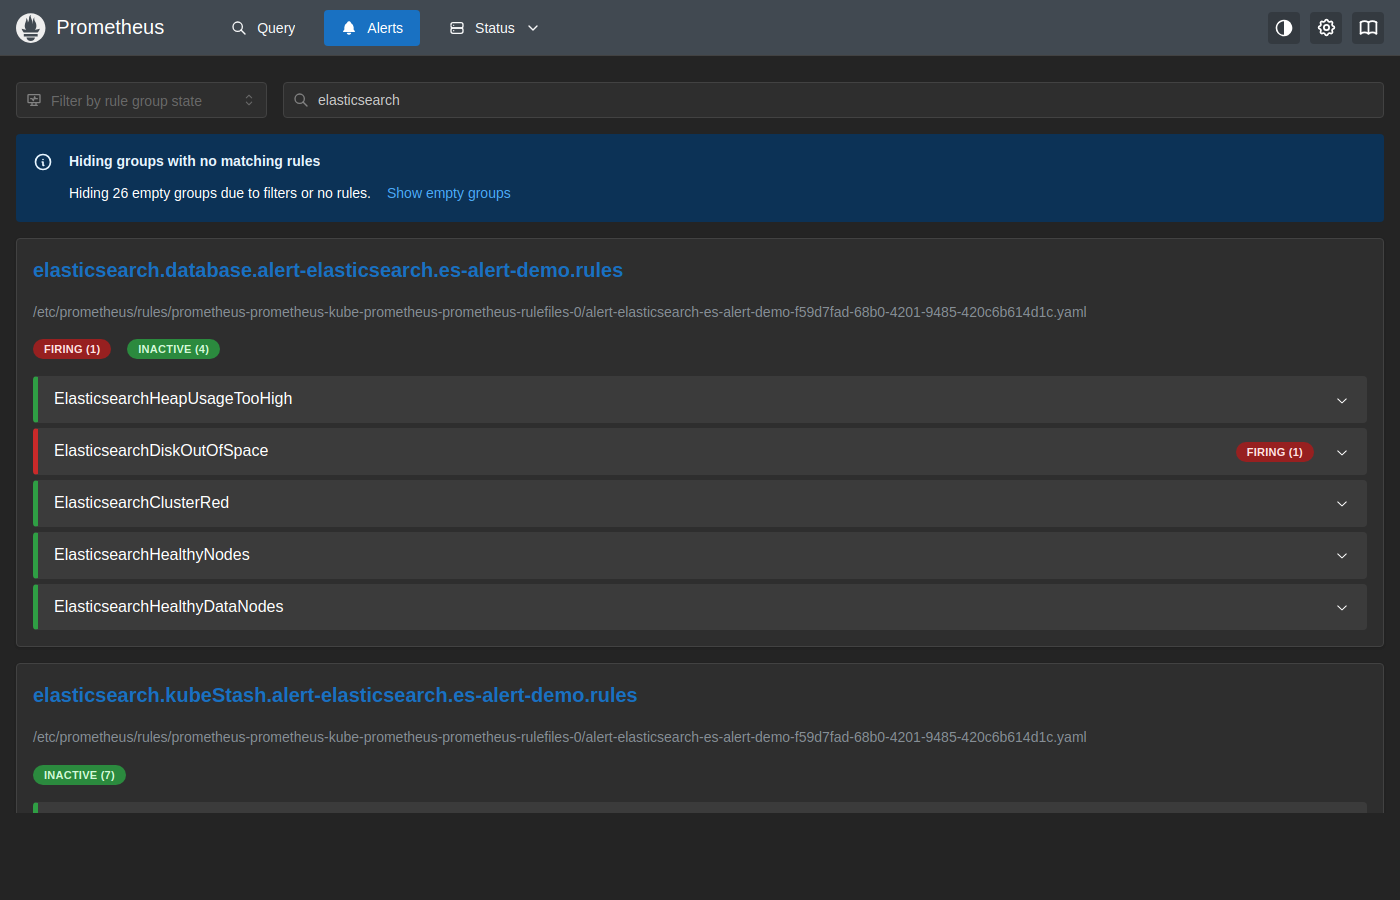
Because ElasticsearchDiskOutOfSpace has for: 0m (instant), it moves directly from INACTIVE to FIRING within one evaluation cycle. The rest of the elasticsearch.database group stays INACTIVE (4).
3. Check the AlertManager dashboard
Open http://localhost:9093/#/alerts?filter={namespace="alert-elasticsearch"}.
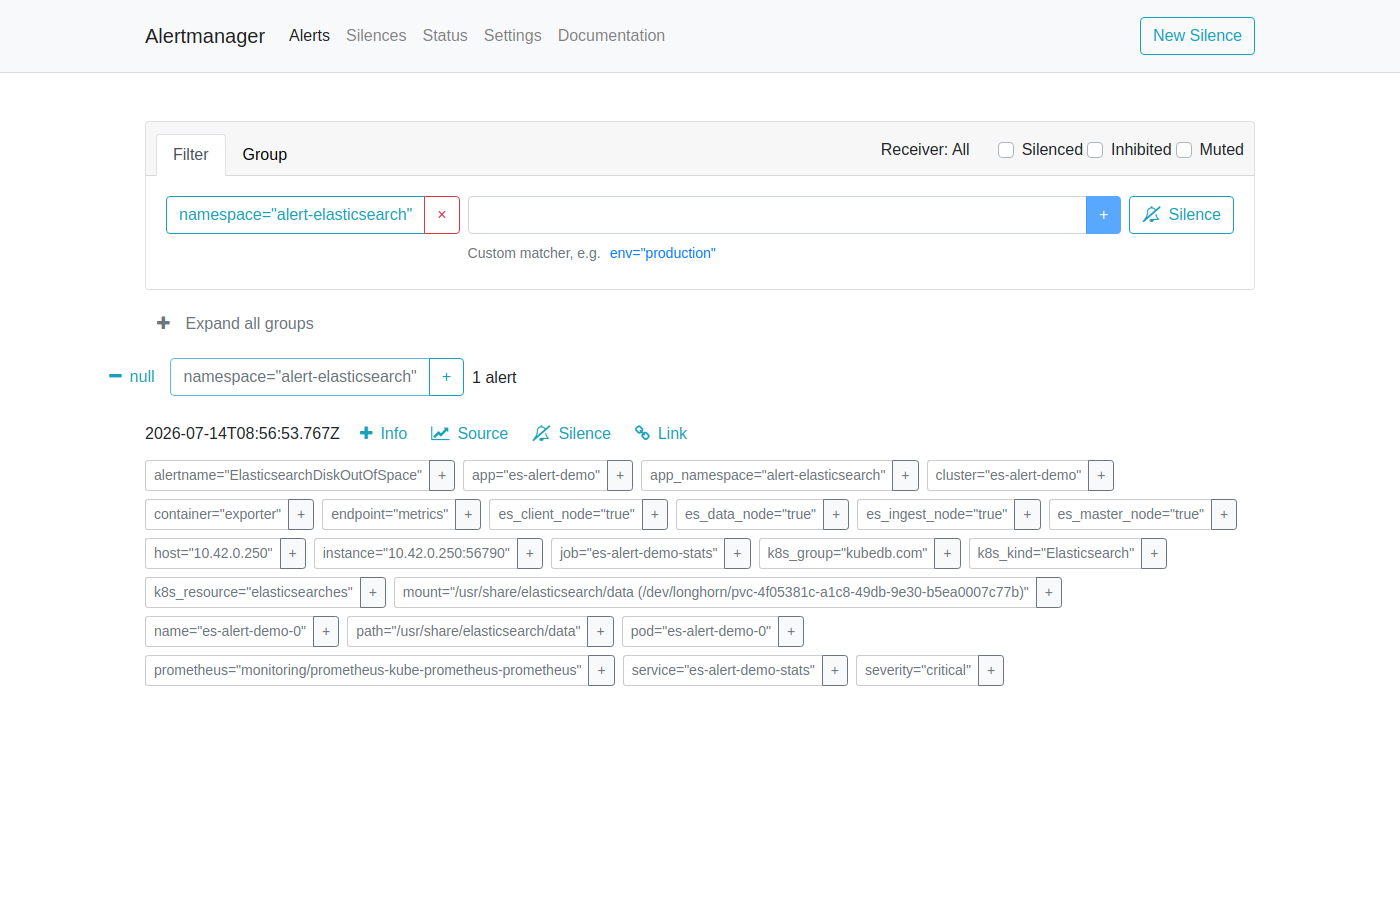
AlertManager shows the ElasticsearchDiskOutOfSpace alert. The alert card displays:
- Severity:
critical - Instance:
es-alert-demo-0in thealert-elasticsearchnamespace - job:
es-alert-demo-stats - mount:
/usr/share/elasticsearch/data (/dev/longhorn/pvc-...) - Started: timestamp when the alert first fired
AlertManager routes this alert to every receiver configured in your alertmanagerConfig (Slack, email, PagerDuty, webhook, etc.) based on your routing tree. If no receiver is configured, the alert is visible here but silently dropped.
4. Restore the disk
Delete the padding file to free up space.
$ kubectl exec -n alert-elasticsearch es-alert-demo-0 -c elasticsearch -- \
    sh -c "rm -rf /usr/share/elasticsearch/data/_disk_filler && df -h /usr/share/elasticsearch/data"
Filesystem                                              Size  Used Avail Use% Mounted on
/dev/longhorn/pvc-4f05381c-a1c8-49db-9e30-b5ea0007c77b  974M  924K  957M   1% /usr/share/elasticsearch/data
Once usage drops back under the threshold, Prometheus marks the alert INACTIVE again and AlertManager sends a resolved notification to all receivers.
Alert Reference
All alerts are scoped to the es-alert-demo instance in the alert-elasticsearch namespace via the PromQL label filters job="es-alert-demo-stats" and namespace="alert-elasticsearch".
Database Group
Fired based on live metrics from the Elasticsearch exporter.
| Alert | Severity | For | What It Means |
|---|---|---|---|
ElasticsearchHeapUsageTooHigh | critical | 2m | The JVM heap usage is over 90%. |
ElasticsearchHeapUsageWarning | warning | 2m | The JVM heap usage is over 80%. |
ElasticsearchDiskOutOfSpace | critical | instant | The disk usage is over 90%. |
ElasticsearchDiskSpaceLow | warning | 2m | The disk usage is over 80%. |
ElasticsearchClusterRed | critical | instant | Elastic Cluster Red status — one or more primary shards are not allocated. |
ElasticsearchClusterYellow | warning | instant | Elastic Cluster Yellow status — one or more replica shards are not allocated. |
ElasticsearchHealthyNodes | critical | instant | Fewer than the configured minimum number of nodes (default 3) are healthy in the cluster. |
ElasticsearchHealthyDataNodes | critical | instant | Fewer than the configured minimum number of data nodes (default 3) are healthy in the cluster. |
ElasticsearchRelocatingShards | info | instant | Elasticsearch is relocating shards. |
ElasticsearchInitializingShards | info | instant | Elasticsearch is initializing shards. |
ElasticsearchUnassignedShards | critical | instant | Elasticsearch has unassigned shards. |
ElasticsearchPendingTasks | warning | 15m | Elasticsearch has pending tasks — the cluster is working slowly. |
ElasticsearchNoNewDocuments10m | info | instant | No new documents were indexed in the last 10 minutes (disabled by default). |
DiskUsageHigh | warning | 1m | Persistent volume usage is high (see the PVC-usage caveat above). |
DiskAlmostFull | critical | 1m | Persistent volume is almost full (see the PVC-usage caveat above). |
Provisioner Group
Monitors the KubeDB operator’s view of the Elasticsearch resource phase.
| Alert | Severity | For | What It Means |
|---|---|---|---|
KubeDBElasticsearchPhaseNotReady | critical | 1m | KubeDB marked the Elasticsearch resource NotReady — operator cannot reach the database. |
KubeDBElasticsearchPhaseCritical | warning | 15m | The instance is in a degraded/critical phase. |
OpsManager Group
Tracks ElasticsearchOpsRequest lifecycle during upgrades, scaling, and reconfiguration.
| Alert | Severity | For | What It Means |
|---|---|---|---|
KubeDBElasticsearchOpsRequestOnProgress | info | instant | An ops request is currently in progress. |
KubeDBElasticsearchOpsRequestStatusProgressingToLong | critical | 30m | An ops request has been running for 30+ minutes — likely stuck. |
KubeDBElasticsearchOpsRequestFailed | critical | instant | An ops request failed — check the ElasticsearchOpsRequest object for the error. |
Stash Group
Tracks backup/restore health for Elasticsearch instances backed up with Stash.
| Alert | Severity | For | What It Means |
|---|---|---|---|
ElasticsearchStashBackupSessionFailed | critical | instant | The most recent Stash backup session failed. |
ElasticsearchStashRestoreSessionFailed | critical | instant | The most recent Stash restore session failed. |
ElasticsearchStashNoBackupSessionForTooLong | warning | instant | No successful backup session in the last 18000s (5 hours). |
ElasticsearchStashRepositoryCorrupted | critical | 5m | The Stash backup repository failed its integrity check. |
ElasticsearchStashRepositoryStorageRunningLow | warning | 5m | The Stash repository has grown beyond 10 GB. |
ElasticsearchStashBackupSessionPeriodTooLong | warning | instant | A backup session took longer than 1800s (30 minutes) to complete. |
ElasticsearchStashRestoreSessionPeriodTooLong | warning | instant | A restore session took longer than 1800s (30 minutes) to complete. |
KubeStash Group
Tracks backup/restore health for Elasticsearch instances backed up with KubeStash.
| Alert | Severity | For | What It Means |
|---|---|---|---|
ElasticsearchKubeStashBackupSessionFailed | critical | instant | The most recent KubeStash backup session failed. |
ElasticsearchKubeStashRestoreSessionFailed | critical | instant | The most recent KubeStash restore session failed. |
ElasticsearchKubeStashNoBackupSessionForTooLong | warning | instant | No successful backup session in the last 18000s (5 hours). |
ElasticsearchKubeStashRepositoryCorrupted | critical | 5m | The KubeStash repository failed its integrity check. |
ElasticsearchKubeStashRepositoryStorageRunningLow | warning | 5m | The KubeStash repository has grown beyond 10 GB. |
ElasticsearchKubeStashBackupSessionPeriodTooLong | warning | instant | A backup session took longer than 1800s (30 minutes) to complete. |
ElasticsearchKubeStashRestoreSessionPeriodTooLong | warning | instant | A restore session took longer than 1800s (30 minutes) to complete. |
Stash and KubeStash alerts are only relevant if you’ve configured backups for this Elasticsearch instance. This tutorial doesn’t set up backups — the tables above are included so you know what’s available in the chart if you do.
Customising Alerts
To override thresholds or disable specific alert groups, create a custom values file and upgrade the chart.
# custom-alerts.yaml
form:
  alert:
    labels:
      release: prometheus
    groups:
      database:
        enabled: warning
        rules:
          elasticsearchHeapUsageWarning:
            enabled: true
            duration: "5m"
            val: 70        # fire at 70% heap usage instead of the default 80%
            severity: warning
      opsManager:
        enabled: "none"    # disable all ops-manager alerts
$ helm upgrade es-alert-demo oci://ghcr.io/appscode-charts/elasticsearch-alerts \
    -n alert-elasticsearch \
    --version=v2026.7.14 \
    -f custom-alerts.yaml
Cleaning up
To remove all resources created in this tutorial, run the following commands.
# Remove the elasticsearch-alerts release
$ helm uninstall es-alert-demo -n alert-elasticsearch

# Remove the Elasticsearch instance
$ kubectl delete elasticsearch -n alert-elasticsearch es-alert-demo

# Delete namespace
$ kubectl delete ns alert-elasticsearch
Next Steps
- Monitor your Elasticsearch database with KubeDB using builtin Prometheus.
- Monitor your Elasticsearch database with KubeDB using Prometheus operator.
- Visualise Elasticsearch metrics with Grafana Dashboard.
- Want to hack on KubeDB? Check our contribution guidelines.